
Huanxia Qiu, Wenbin Yu, Jianli Song, Jia Deng, Yunyi Li, Qilin Deng. Numerical Simulation of Laser Cladding 316L/H13+ 20% WC Composite Coating on H13 Steel Surface[J]. Laser & Optoelectronics Progress, 2022, 59(3): 0314002
- Laser & Optoelectronics Progress
- Vol. 59, Issue 3, 0314002 (2022)
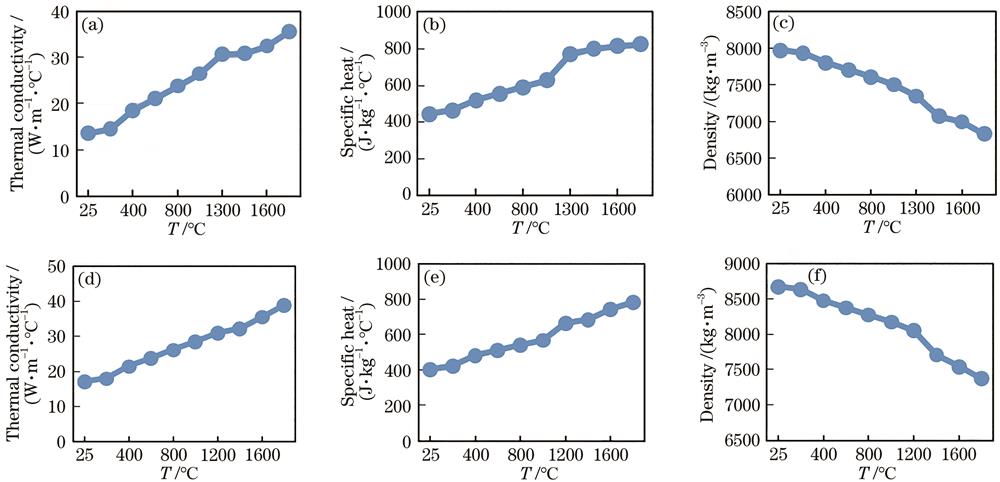
Fig. 1. Thermo-physical parameters of 316L and H13+20%WC. (a)-(c) 316L; (d)-(f) H13+20%WC
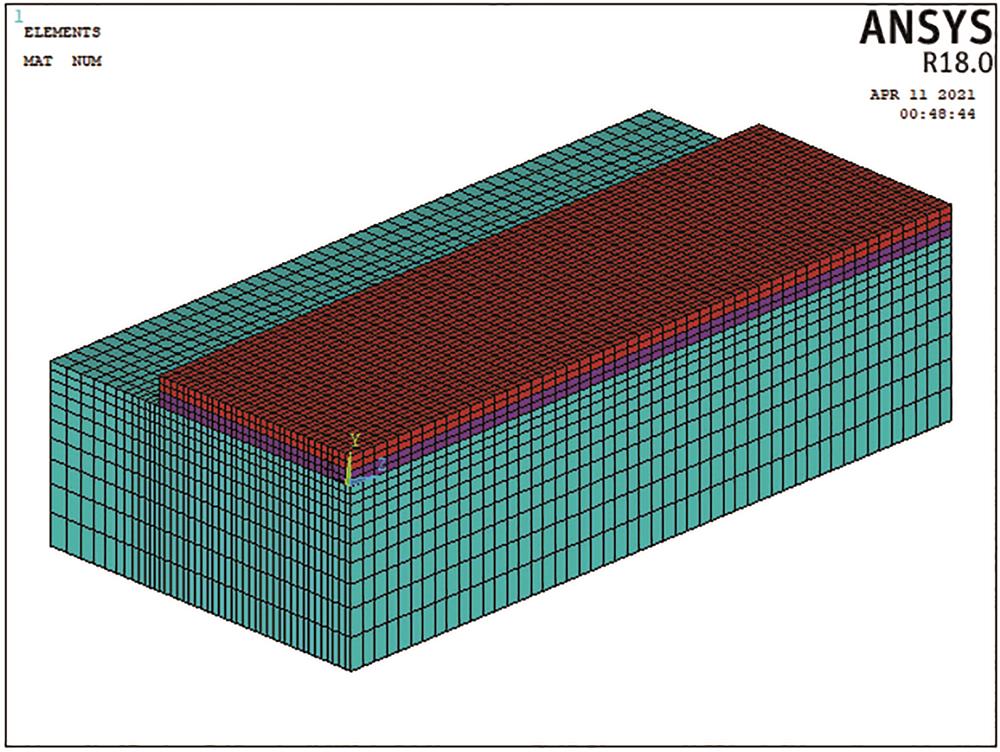
Fig. 2. Finite element model and mesh division
Fig. 3. Diagram of nodes selection for temperature gradient calculation
Fig. 4. Temperature gradient of selected nodes change with time. (a) Node 1; (b) node 2; (c) node 3; (d) curves of maximum temperature gradient with preheating temperature for node 1 and node 3
Fig. 5. Variation of temperature gradient of selected nodes change with time. (a) (b) Node 1; (c) (d) node 2; (e) (f) node 3
Fig. 6. Diagram of nodes selection for temperature variation rate calculation
Fig. 7. Curves of temperature change with time at different preheating temperatures of selected nodes. (a) Node 4; (b) node 5
Fig. 8. Curves of temperature variation rate at cladding pool edge change with time of selected nodes. (a) Node 4; (b) node 5
Fig. 9. Curves of variation of temperature variation rate at cladding pool edge change with time of selected nodes. (a) Node 4; (b) node 5
Fig. 10. Microstructure of laser cladding forming 316L/H13+20%WC composite coatings under different conditions of substrate. (a) Crack at the cladding layer bonding under room temperature of substrate; (b) bottom microstructure of 316L cladding layer under 200 ℃ preheating of substrate; (c) microstructure of the cladding layer bonding under 200 ℃ preheating of substrate; (d) top microstructure of H13+20%WC cladding layer under 200 ℃ preheating of substrate
|
Table 1. Thermo-physical parameters of H13 steel
| ||||||||||||||||||||||||||||||||||
Table 2. Maximum of variation of temperature gradient of selected nodes
| |||||||||||||||||||||||||||||||||||
Table 3. Composition of experiment materials

Set citation alerts for the article
Please enter your email address
© Copyright 2018-2021 | Chinese Laser Press. All Rights Reserved 沪ICP备15018463号-20