• Chinese Optics Letters
  • Vol. 20, Issue 3, 031702 (2022)
Yuxi Shang1, Hailang Dai1、*, Daopeng Dai2, Jinmao Gu3, Meng Zhang1, Qiheng Wei1, and Xianfeng Chen1、4、5、6、**
Author Affiliations
  • 1State Key Laboratory of Advanced Optical Communication Systems and Networks, School of Physics and Astronomy, Shanghai Jiao Tong University, Shanghai 200240, China
  • 2Department of Cardiology, Ruijin Hospital, Shanghai Jiao Tong University School of Medicine, Shanghai 200240, China
  • 3The Affiliated Hospital of Tianjin Chinese Medical Institute, Tongji University, Shanghai 200092, China
  • 4Shanghai Research Center for Quantum Sciences, Shanghai 201315, China
  • 5Jinan Institute of Quantum Technology, Jinan 250101, China
  • 6Collaborative Innovation Center of Light Manipulation and Applications, Shandong Normal University, Jinan 250358, China
  • show less
    DOI: 10.3788/COL202220.031702 Cite this Article Set citation alerts
    Yuxi Shang, Hailang Dai, Daopeng Dai, Jinmao Gu, Meng Zhang, Qiheng Wei, Xianfeng Chen. Secondary structure changes of ox-LDL by photoirradiation in an optofluidic resonator[J]. Chinese Optics Letters, 2022, 20(3): 031702 Copy Citation Text show less
    Structure and properties of the HCMW. (a) HCMW 3D schematic diagram. (b) The COMSOL simulation image of the HCMW. (c) The reflectivity simulation image of the HCMW with different imaginary parts of dielectric coefficient εi (from 0 to 1 × 10⁵).
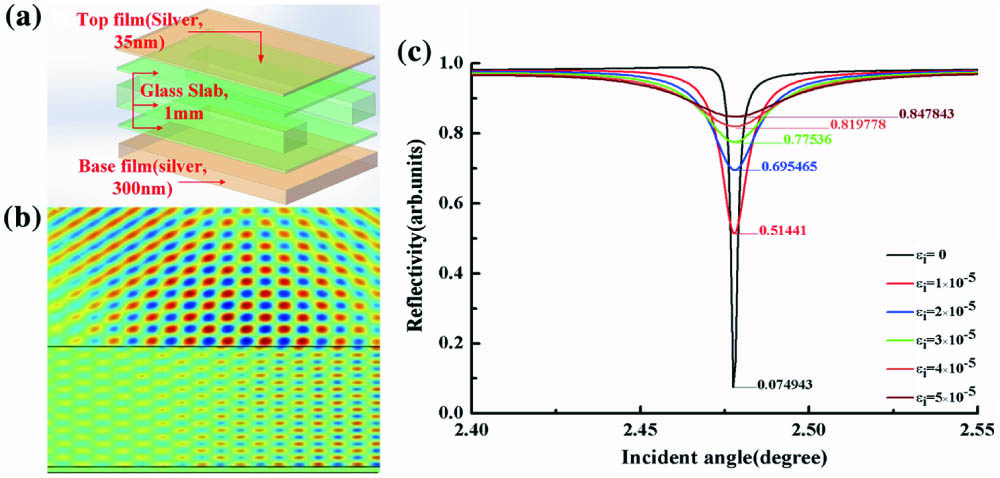
    Fig. 1. Structure and properties of the HCMW. (a) HCMW 3D schematic diagram. (b) The COMSOL simulation image of the HCMW. (c) The reflectivity simulation image of the HCMW with different imaginary parts of dielectric coefficient εi (from 0 to 1 × 10⁵).
    Variation of ox-LDL in different light fields. (a) and (b) Structures of LDL and ox-LDL, respectively. Meanwhile, the detailed components are described in Supplementary Materials. (c) HCMW 3D schematic diagram. (d) Quartz cuvette. (e) The ox-LDL, which is illuminated in the HCMW. (f) The ox-LDL, which is illuminated in the cuvette. (g) The experimental reflection spectra for ox-LDL with different time exposures to the laser in the HCMW. (h) The experimental reflection spectra for ox-LDL with different time exposures to the laser in the cuvette.
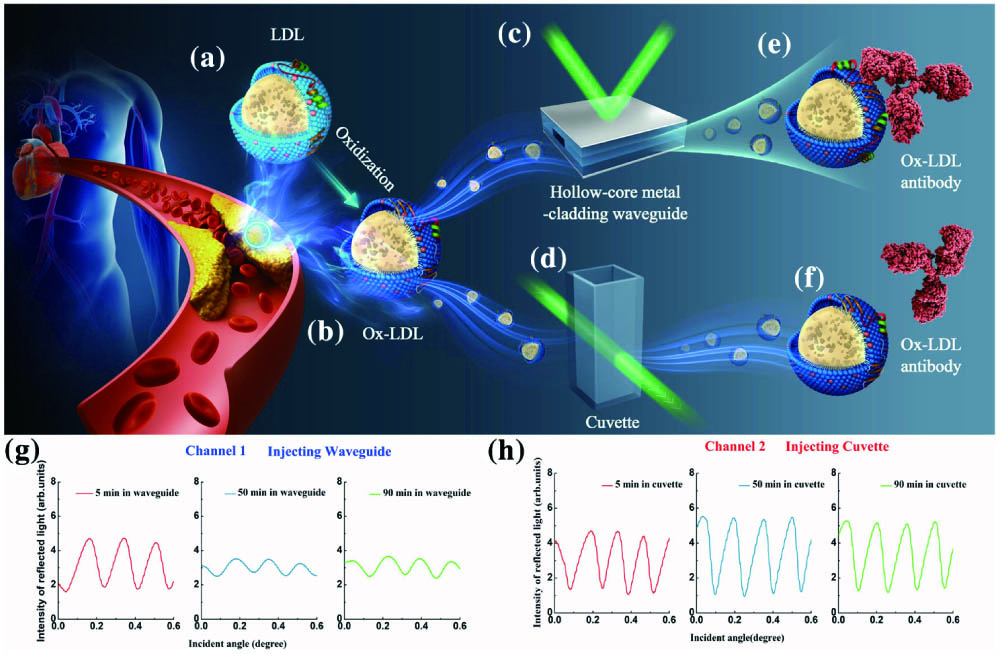
    Fig. 2. Variation of ox-LDL in different light fields. (a) and (b) Structures of LDL and ox-LDL, respectively. Meanwhile, the detailed components are described in Supplementary Materials. (c) HCMW 3D schematic diagram. (d) Quartz cuvette. (e) The ox-LDL, which is illuminated in the HCMW. (f) The ox-LDL, which is illuminated in the cuvette. (g) The experimental reflection spectra for ox-LDL with different time exposures to the laser in the HCMW. (h) The experimental reflection spectra for ox-LDL with different time exposures to the laser in the cuvette.
    ELISA experiment of ox-LDL after laser illumination. (a) Schematic illustration of ELISA experiment. (b) Optical density comparison of unilluminated ox-LDL and 40 min illuminated ox-LDL in the HCMW, respectively.
    Fig. 3. ELISA experiment of ox-LDL after laser illumination. (a) Schematic illustration of ELISA experiment. (b) Optical density comparison of unilluminated ox-LDL and 40 min illuminated ox-LDL in the HCMW, respectively.
    Comparison of different experiment parameters. (a) The measured reflection spectra of the HCMW filled with different laser continuous irradiation time ox-LDL. (b) Image of ΔR with different laser irradiation time. (c) and (d) The measured reflection spectra of the HCMW filled with ox-LDL under the irradiation of 5 mW and 50 mW laser beams, respectively. (e) and (f) The measured reflection spectra of the HCMW filled with ox-LDL illuminated by 473 nm and 532 nm lasers, respectively.
    Fig. 4. Comparison of different experiment parameters. (a) The measured reflection spectra of the HCMW filled with different laser continuous irradiation time ox-LDL. (b) Image of ΔR with different laser irradiation time. (c) and (d) The measured reflection spectra of the HCMW filled with ox-LDL under the irradiation of 5 mW and 50 mW laser beams, respectively. (e) and (f) The measured reflection spectra of the HCMW filled with ox-LDL illuminated by 473 nm and 532 nm lasers, respectively.
    Analysis of ox-LDL structures variation after laser irradiation. (a) and (b) 1H NMR spectra of ox-LDL before laser irradiation and after 40 min irradiation in the HCMW, respectively. (c) and (d) Micro-IR spectra of ox-LDL before laser irradiation and after 40 min illumination in the HCMW, respectively. (e) and (f) Circular dichroism (CD) spectra of both states of ox-LDL in the HCMW, respectively: CD (black), HT (red), and absorption of solution (blue).
    Fig. 5. Analysis of ox-LDL structures variation after laser irradiation. (a) and (b) 1H NMR spectra of ox-LDL before laser irradiation and after 40 min irradiation in the HCMW, respectively. (c) and (d) Micro-IR spectra of ox-LDL before laser irradiation and after 40 min illumination in the HCMW, respectively. (e) and (f) Circular dichroism (CD) spectra of both states of ox-LDL in the HCMW, respectively: CD (black), HT (red), and absorption of solution (blue).
    (a) and (b) Experimental CD spectra (black), software simulation curves (red), and the difference between the measured CD spectra and software simulation curves (blue).
    Fig. 6. (a) and (b) Experimental CD spectra (black), software simulation curves (red), and the difference between the measured CD spectra and software simulation curves (blue).
    Group No.BeforeAfterRate of Increase (%)
    10.2160.25317.20
    20.1750.1929.70
    30.2010.22210.40
    40.1410.19739.70
    50.2710.2824.10
    60.1720.1783.40
    70.1820.1904.40
    80.2170.2243.20
    90.2110.28225.20
    100.2370.2474.20
    Average0.20230.226712.15
    Table 1. Experiment Data of ox-LDL ELISA, Both Exposed and Unexposed
    Yuxi Shang, Hailang Dai, Daopeng Dai, Jinmao Gu, Meng Zhang, Qiheng Wei, Xianfeng Chen. Secondary structure changes of ox-LDL by photoirradiation in an optofluidic resonator[J]. Chinese Optics Letters, 2022, 20(3): 031702
    Download Citation