Author Affiliations
1College of Information Engineering, Shenyang University of Chemical Technology, Shenyang 110142, China2Shenyang Institute of Automation, Chinese Academy of Sciences, Shenyang 110016, Chinashow less
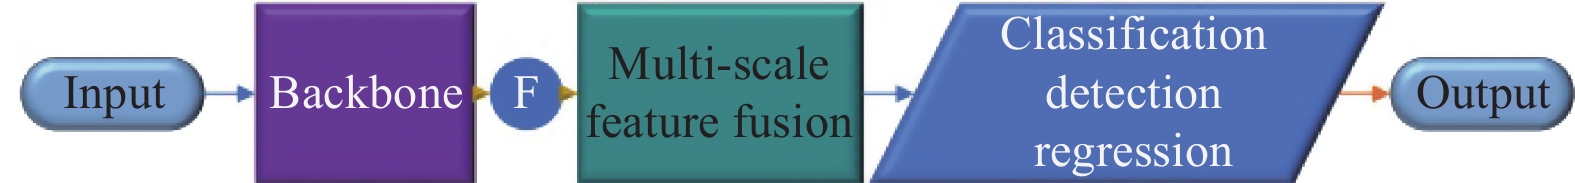
Fig. 1. YOlOv3 flow chart of detection
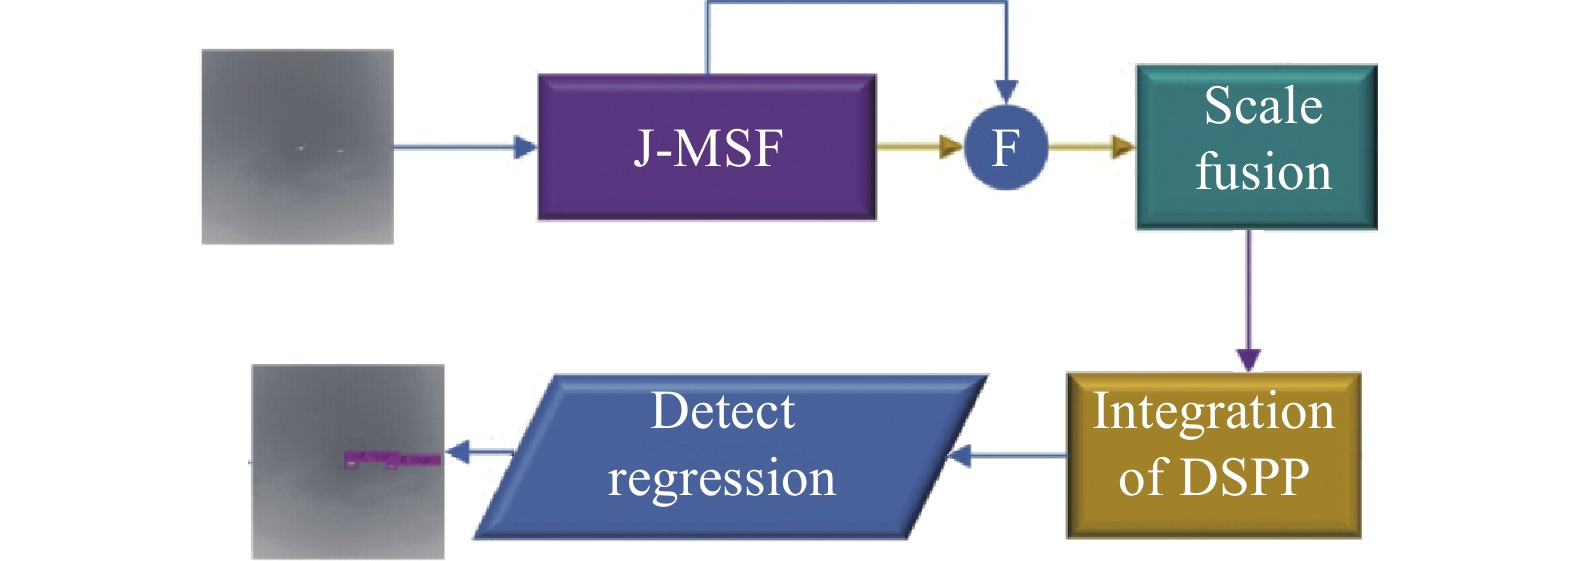
Fig. 2. Detection flow chart of J-MSF
Fig. 3. Structural unit of JAnet
Fig. 4. Network structure of J-MSF
Fig. 5. Pixel value of target in test set sequence
Fig. 6. Training loss curve
Fig. 7. (a) Mark contrast box; (b) YOLO-Tiny detection result; (c) YOLOv3 detection result; (d) YOLOv3+SPP detection result; (e) Gaussian YOLOv3+SPP detection result; (f) YOLOv4 detection result; (g) J-MSF detection result
Fig. 8. (a) YOLO-Tiny Precision-R curve; (b) YOLOv3 Precision-R curve; (c) YOLOv3+SPP Precision-R curve; (d) Gaussian YOLOv3+SPP Precision-R curve; (e) YOLOv4 Precision-R curve; (f) J-MSF Precision-R curve
Fig. 9. Mainstream algorithm FPS-AP curve
Fusion map/layer | Kernel
size
| Output size | Stride | Channel | Basic-feature map | - | 8×8 | - | 1024 | Artery-feature map | - | 16×16 | - | 768 | Detection map 1 | - | 32×32 | - | 30 | Detection map 2 | - | 64×64 | - | 30 | Detection map 3 | - | 128×128 | - | 30 | Maxpooling 1 | 3 | 32×32 | 1 | 128 | Maxpooling 2 | 5 | 32×32 | 1 | 128 | Maxpooling 3 | 7 | 32×32 | 1 | 128 |
|
Table 1. Dimensions of network parameters
SNR region | 3.26-3 | 3-2 | 2-1 | 1-0 | 0-(−1.97) | −3-(−20) | Data4 | 0 | 5 | 209 | 379 | 204 | 2 | Data8 | 2 | 39 | 108 | 94 | 101 | 55 | Data12 | 5 | 84 | 407 | 424 | 341 | 238 | Data16 | 5 | 247 | 214 | 15 | 1 | 12 | Data20 | 0 | 12 | 155 | 197 | 29 | 8 | Total | 12 | 387 | 1093 | 1109 | 676 | 315 |
|
Table 2. SNR data distribution table of test set
Model | $\mathop X\nolimits_{FN} $![]() ![]() | R | AP | Darknet-53 | 458 | 87.2% | 86.38% | Darknet-53-JA | 343 | 90.0% | 88.43% | J-MSF | 217 | 94.0% | 93.13% |
|
Table 3. Contrast experiment of JAnet network
Darknet53 | J-MSF | Loss | Fusion | Precision
| R | AP
| FPS | √ | - | D | - | 86% | 87.20% | 86.38% | 66.3 | √ | - | D | √ | 92% | 92.20% | 92.74% | 57.5 | √ | - | M | - | 89% | 94.04% | 93.88% | 71.9 | √ | - | M | √ | 82% | 95.00% | 93.47% | 71.6 | - | √ | D | - | 90% | 94.00% | 93.13% | 59.0 | - | √ | D | √ | 90% | 94.10% | 93.46% | 73.4 | - | √ | M | - | 86% | 95.85% | 94.80% | 66.8 | - | √ | M | √ | 88% | 96.27% | 96.29% | 67.6 |
|
Table 4. Ablation study
Detection algorithm | $\mathop X\nolimits_{TP} $![]() ![]() | $\mathop X\nolimits_{FP} $![]() ![]() | $\mathop X\nolimits_{FN} $![]() ![]() | Precision | R | AP | YOLO-Tiny | 2389 | 1355 | 1203 | 59% | 64% | 45.32% | YOLOv3 | 3309 | 435 | 283 | 88% | 92% | 86.38% | YOLOv3+SPP[17] | 3318 | 283 | 274 | 92% | 92% | 92.74% | Gaussian YOLOv3[18]+SPP
| 3407 | 758 | 185 | 78% | 95% | 93.60% | YOLOv4 | 3397 | 446 | 195 | 88% | 95% | 93.13% | J-MSF | 3443 | 451 | 149 | 88% | 96% | 96.29% |
|
Table 5. Results of infrared target detection by YOLO serial model
Detection algorithm | AP | FPS | Faster R-CNN[20] | 43.7% | 35.2 | SSD300[21] | 52.3% | 154.7 | RefineDet[22] | 63.9% | 70.1 | RetinaNet[23] | 65.4% | 80.3 | YOLOv3 | 86.4% | 66.3 | YOLOv4 | 93.1% | 66.8 | J-MSF | 96.3% | 67.6 |
|
Table 6. Comparison of mainstream algorithms