• Acta Optica Sinica
  • Vol. 42, Issue 8, 0817001 (2022)
Jing Yuan1、2, Yuejin Zhao1、2、3、*, Lingqin Kong1、2、3、**, Ge Xu1、2, Liquan Dong1、2、3, Ming Liu1、2、3, and Mei Hui1、2
Author Affiliations
  • 1School of Optics and Photonics, Beijing Institute of Technology, Beijing 100081, China
  • 2Beijing Key Laboratory for Precision Optoelectronic Measurement Instrument and Technology, Beijing 100081, China
  • 3Yangtze Delta Region Academy, Beijing Institute of Technology, Jiaxing, Zhejiang 314019, China
  • show less
    DOI: 10.3788/AOS202242.0817001 Cite this Article Set citation alerts
    Jing Yuan, Yuejin Zhao, Lingqin Kong, Ge Xu, Liquan Dong, Ming Liu, Mei Hui. Simulation Analysis of Skin Diffuse Reflectance Spectroscopy and Skin Color with Blood Component Change[J]. Acta Optica Sinica, 2022, 42(8): 0817001 Copy Citation Text show less
    Molar extinction coefficient spectra of various skin tissue components in visible light band
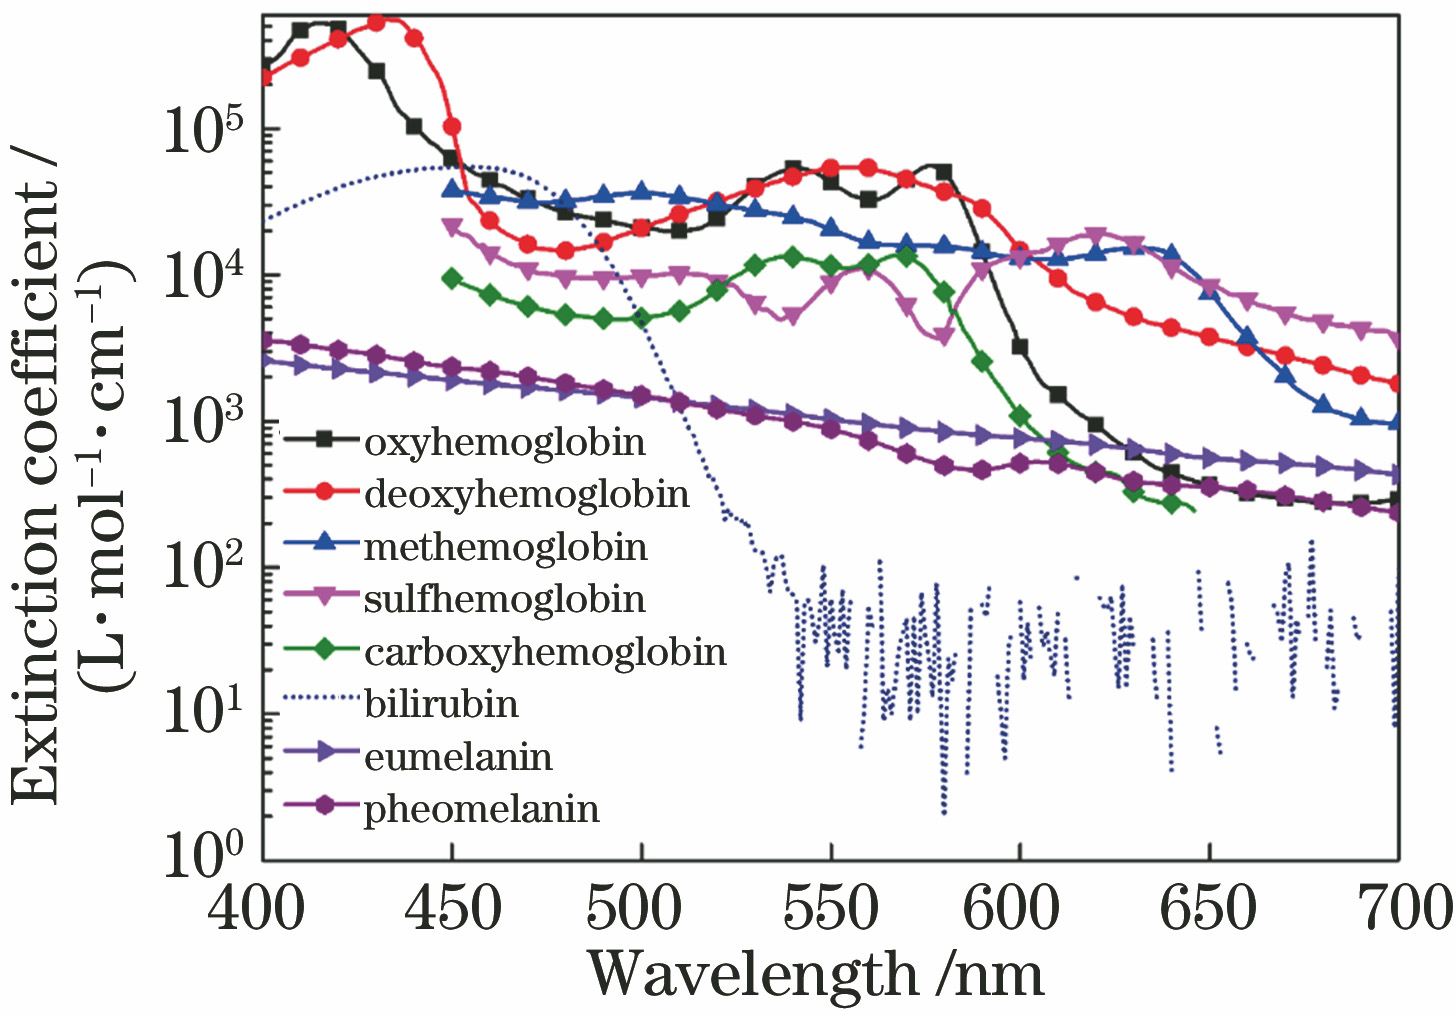
    Fig. 1. Molar extinction coefficient spectra of various skin tissue components in visible light band
    Spectral power distribution of CIE D65 light source and color matching function in CIEXYZ space
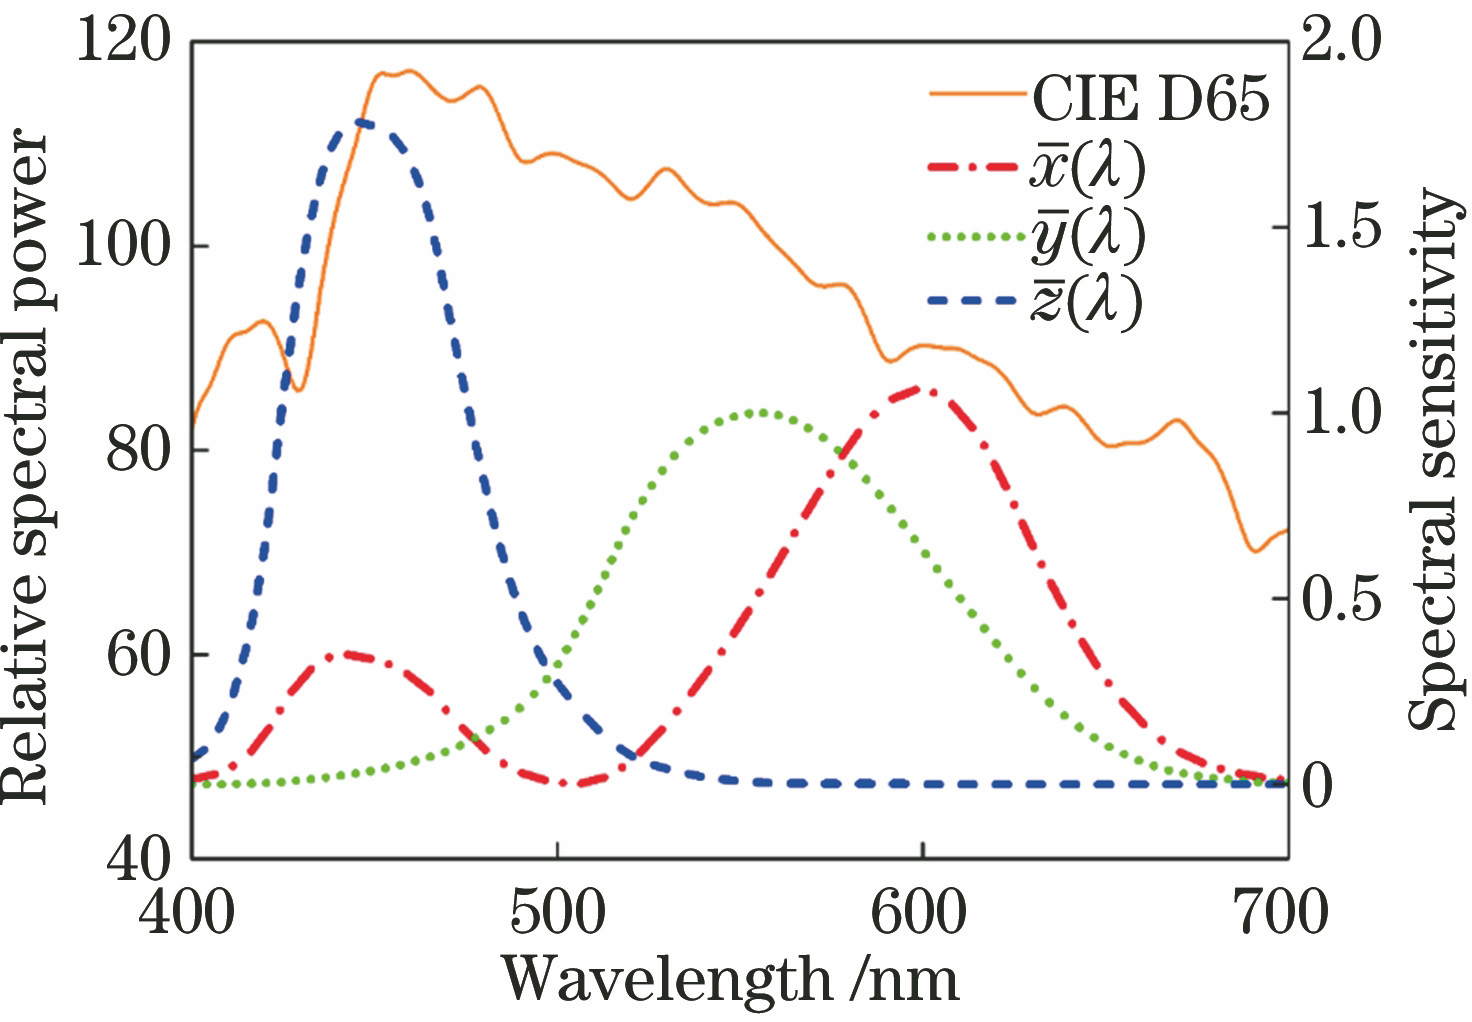
    Fig. 2. Spectral power distribution of CIE D65 light source and color matching function in CIEXYZ space
    Effect of volume of chromophores in skin on diffuse reflectance spectrum. (a) Effect of changes in blood volume fraction on diffuse reflectance spectrum; (b) effect of volume fraction of melanin on diffuse reflectance spectrum
    Fig. 3. Effect of volume of chromophores in skin on diffuse reflectance spectrum. (a) Effect of changes in blood volume fraction on diffuse reflectance spectrum; (b) effect of volume fraction of melanin on diffuse reflectance spectrum
    Effect of total hemoglobin concentration and blood oxygen saturation on diffuse reflectance spectrum. (a) Effect of total hemoglobin concentration on diffuse reflectance spectrum; (b) effect of blood oxygen saturation on diffuse reflectance spectrum
    Fig. 4. Effect of total hemoglobin concentration and blood oxygen saturation on diffuse reflectance spectrum. (a) Effect of total hemoglobin concentration on diffuse reflectance spectrum; (b) effect of blood oxygen saturation on diffuse reflectance spectrum
    Effect of nonfunctional hemoglobin concentration on diffuse reflectance spectrum. (a) Effect of methemoglobin concentration on diffuse reflectance spectrum; (b) effect of sulfhemoglobin concentration on diffuse reflectance spectrum
    Fig. 5. Effect of nonfunctional hemoglobin concentration on diffuse reflectance spectrum. (a) Effect of methemoglobin concentration on diffuse reflectance spectrum; (b) effect of sulfhemoglobin concentration on diffuse reflectance spectrum
    Effect of bilirubin concentration on diffuse reflectance spectrum
    Fig. 6. Effect of bilirubin concentration on diffuse reflectance spectrum
    Skin color with different peripheral blood volume and melanin volume
    Fig. 7. Skin color with different peripheral blood volume and melanin volume
    Skin color at different hemoglobin concentrations
    Fig. 8. Skin color at different hemoglobin concentrations
    Skin color at different oxygen saturation levels. (a) Skin colour at different oxygen saturation levels at 2% of blood volume; (b) skin color at different oxygen saturation levels at 7% of blood volume
    Fig. 9. Skin color at different oxygen saturation levels. (a) Skin colour at different oxygen saturation levels at 2% of blood volume; (b) skin color at different oxygen saturation levels at 7% of blood volume
    Skin color at different nonfunctional hemoglobin concentrations. (a) Skin color at different methemoglobin concentrations; (b) skin color at different sulfhemoglobin concentrations
    Fig. 10. Skin color at different nonfunctional hemoglobin concentrations. (a) Skin color at different methemoglobin concentrations; (b) skin color at different sulfhemoglobin concentrations
    Skin color at different bilirubin concentrations
    Fig. 11. Skin color at different bilirubin concentrations
    Distribution of skin color in color space under different skin tissue parameters. (a) Distribution of normal skin color in color space; (b) distribution of cyanosis in color space; (c) distribution of jaundiced skin color in colour space; (d) distribution of normal skin color and abnormal skin color in color space
    Fig. 12. Distribution of skin color in color space under different skin tissue parameters. (a) Distribution of normal skin color in color space; (b) distribution of cyanosis in color space; (c) distribution of jaundiced skin color in colour space; (d) distribution of normal skin color and abnormal skin color in color space
    Skin color with cyanosis caused by abnormal oxygen saturation, abnormal methemoglobin concentration, and abnormal sulfur hemoglobin concentration and corresponding diffuse reflectance spectrum
    Fig. 13. Skin color with cyanosis caused by abnormal oxygen saturation, abnormal methemoglobin concentration, and abnormal sulfur hemoglobin concentration and corresponding diffuse reflectance spectrum
    ParameterValue
    Epidermis thickness d1[27] /cm0.01
    Dermis thickness d2[28] /cm0.145
    Subcutaneous tissue thickness d3[28] /cm0.6
    Anisotropy factor (all tissues) g0.9
    Refractive index (all tissues) n1.4
    Number of photons P0107
    Table 1. Simulation parameter of skin
    Jing Yuan, Yuejin Zhao, Lingqin Kong, Ge Xu, Liquan Dong, Ming Liu, Mei Hui. Simulation Analysis of Skin Diffuse Reflectance Spectroscopy and Skin Color with Blood Component Change[J]. Acta Optica Sinica, 2022, 42(8): 0817001
    Download Citation