Author Affiliations
1Institute of Geographic Sciences and Natural Resources Research, CAS, State Key Laboratory of Re-sources and Environmental Information System, Beijing 100101, China2University of Chinese Academy of Sciences, Beijing 100190, China3Institute of UAV Application Research, Tianjin and CAS, Tianjin 301800, China4The Research Center for UAV Applications and Regulation, CAS, Beijing 100101, Chinashow less
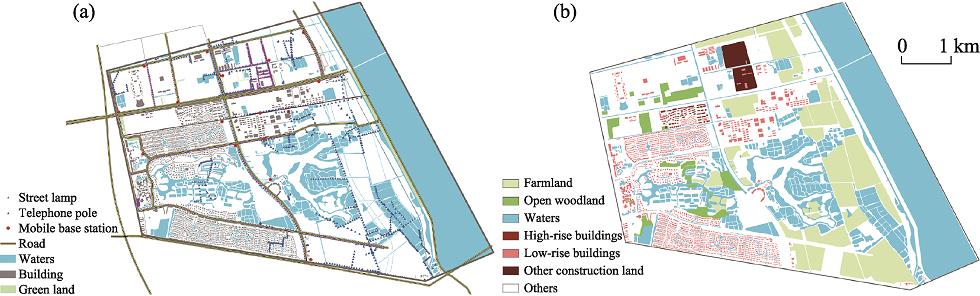
Fig. 1. Ground objects distribution (a) and land use classification (b) in JJXC district
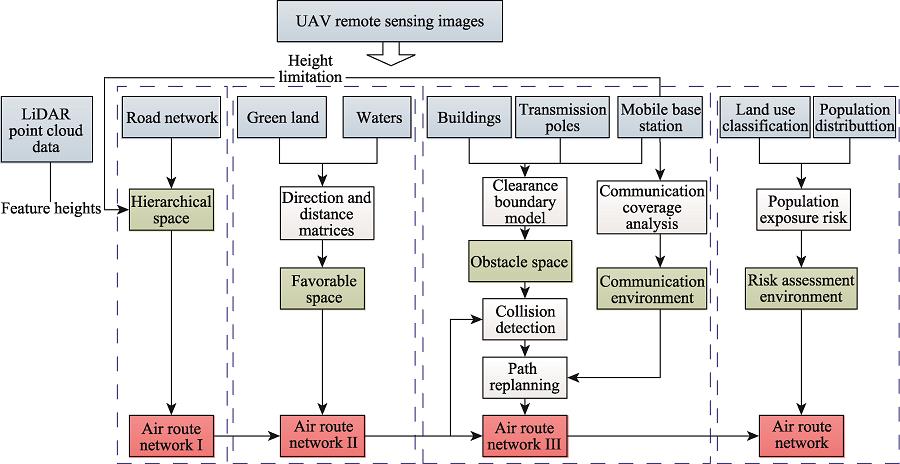
Fig. 2. Roadmap of iteratively constructing the multi-level air route network in urban areas
Fig. 3. The Cumulative Distribution Function (CDF) for RSRP index of the single base station
Fig. 4. Schematic diagram of single base station signal modeling at 120-m height
Fig. 5. Schematic diagram of regional signal distribution of base stations at 120-m height
Fig. 6. Moving distances for each class I air route obtained from actual investigations
Fig. 7. Diagram of comparison among the initial path, moved path and smoothed path
Fig. 8. Flowchart of the main process of constructing the class III air route network (DEM: Digital Elevation Model)
Fig. 9. Low-altitude UAV air route network and its local enlarged map in the JJXC district (Red lines: type 1 air routes; blue lines: type 2 air routes; yellow lines: type 3 air routes)
Fig. 10. Population exposure risk distribution of UAV operation in the study area
Fig. 11. Maps showing each iterative air route network (a. class I air route network; b. class II air route network; c. class III air route network)
Fig. 12. Enlarged local map for class I-III air routes
Fig. 13. Direct and iterative paths for population risk comparison
Fig. 14. Air route network construction process (a. class I air route based on roads; b. class II air route based on favorable space; c. class III air route based on obstacle space; red line: re-planned air route segments)
| Step | Key technology | Required elements | Optional elements | Required data processing |
|---|
| I | Hierarchi-cal planning | Road network: urban expressway, urban main road, community or campus internal trunk roadMobile base station. | Roads around buildings within a community or campus. | Road network: extract the road area and its center line and measure the road width. The road is stored in the form of shapefile. A road is a record composed of the coordinate values of feature points.Mobile base station: analyze the communication coverage limit and determine the regional route height limit accordingly. | | II | Utilizing positive constraints | None. The positive constraint element is only auxiliary but not required. | Urban green belt, isolation belt, grassland, street trees, parks, and other green areas; rivers, large areas of waters, ditches, and other water sources. | Green space: the relative position with the road determines the translation direction and translation distance, and thus the direction and translation distance matrices.Water area: the relative position with the road determines the translation direction and translation distance, and thus the direction and translation distance matrices. | | III | Avoiding negative constraints | General obstacles: buildings, mobile base station tower poles, street lamps, power lines (poles), etc. | Other obstacles, such as terrain in constructing the route in mountainous areas. | Mobile base station: the clearance boundary modeling of the tower pole is used to build an “obstacle” environment, and the communication coverage is modeled to analyze the spatial signal distribution.Other ground objects: to construct a mathematical model of clearance boundary. |
|
Table 1. The minimum general element set for the iterative construction process of regional air route network
| Types | Function | Constraints | Height (m) | Minimum height (m) | Platform |
|---|
| 1 | Connecting urban areas with the outside area | Higher than most of ground objects in urban area | 70-300 | 70 | Fixed wing/multi- rotor UAV | | 2 | Main traffic routes inside the urban areas | Higher than lamps, trees, and buildings along roads | 50-70 | 50 | Multi-rotor UAV | | 3 | Internal air route of community units in urban area | None | 15-50 | 30 | Multi-rotor UAV |
|
Table 2. Air route classification and relative attributes in JJXC district (Xu et al., 2020)
| Code | Type | Sheltering factor |
|---|
| 12 | Farmland | 0 | | 23 | Open woodland (canopy density 10%-30%) | 2.5 | | 41 | Waters | 0 | | 51 | High-rise buildings | 7.5 | | 52 | Low-rise buildings | 5 | | 53 | Other construction land: factories and mines, large industrial zones, oil fields, salt fields, quarries and other patches of land; traffic roads, airports, and special areas | 10 | | 61 | Others, including of unexploited land (e.g., deserts, salt flats, marshes) | 0 |
|
Table 3. Sheltering factor for each type of land use
| Type | Population exposure risk index (PERI) |
|---|
| Average | Variance | Average | Variance | Average | Variance |
|---|
| Type 1 | Type 2 | Type 3 | | Class I | 62.42 | 62.92 | 158 | 0 | 117.47 | 62.14 | | Class II | 21.75 | 9.05 | 25.98 | 15.35 | 23.92 | 17.88 | | Class III | 21.74 | 8.89 | 25.06 | 14.05 | 25.37 | 22.17 |
|
Table 4. Comparison of the population exposure risk for iterative UAV low-altitude air route network