
Chenchen XU, Xiaohan LIAO, Huping YE, Huanyin YUE. Iterative construction of low-altitude UAV air route network in urban areas: Case planning and assessment[J]. Journal of Geographical Sciences, 2020, 30(9): 1534
- Journal of Geographical Sciences
- Vol. 30, Issue 9, 1534 (2020)
Abstract
1 Introduction
Recently, the number of UAVs continues to increase (
Research on low-altitude air routes at home and abroad focus on the construction of the “road”. For example, a Singaporean group proposed the concept of constructing air-route systems over cities in 2014, and then carried out the dynamic planning of the air routes (
Our team proposes innovative concepts and the progressive technological path for iteratively constructing the UAV air route network from the perspective of multiple cross-disciplines such as geographic information and remote sensing technology in earlier work (
This method improves the air route layout dynamically and flexibly and updates the geographical elements locally, which is more scientific and reasonable compared with the traditional method of planning civil aviation airlines. This paper seeks to deepen research based on existing theoretical systems and technical paths. Taking the Jing-Jin-Xincheng (JJXC) district of Tianjin in China as a demonstration area, the iterative construction process and technical details of the low-altitude UAV air route network are described in detail and its feasibility is verified by risk assessment. Generating a class I air route network based on ground roads can make full use of the traffic infrastructure and allow close connection with ground transportation. Additionally, avoiding obstacles and verifying the environment map of UAV flights with actual measurement data can ensure flight safety. Compared with previous studies, the iterative construction method proposed in this paper can fully utilize the ground traffic layout and infrastructures, fully combine the characteristics of ground pattern and fully utilize rich surface geographic information to solve the efficient and safe construction of UAV low-altitude air route network. This paper forms a comprehensive solution for managing low-altitude UAV traffic in urban areas by combining the disciplines of aviation, transportation and geography.
2 Study region and data
This paper considers JJXC district of Tianjin in China, with convenient transportation and excellent geographical location, as a typical urban area to construct the low-altitude air route network. The area is about 29 km2 in a flat terrain with an average elevation of less than 10 m. Its land use is mainly farmland and rivers, and the proportion of buildings and the population density is relatively low. The building types are mainly low-rise villas and campuses, generally below 70 meters. As a typical urban demonstration area, constructing the low-altitude air route network here can not only reduce the risk of UAV operations to the public, but also reduce the interference of buildings and terrain on the UAV communication.
Data used to construct the low-altitude air route network in this study include orthophoto images of the study area and LiDAR point cloud data along the road. The orthophoto image, captured by a visible light camera mounted on a fixed-wing UAV at a height of 100 m and a sideline overlap of 80%, has a resolution of 0.05 m and is used to extract objects sensitive to UAV flights, such as roads and buildings. The laser-point cloud data, collected and processed by the vehicle-mounted lightweight 3D laser moving measurement system, is used to obtain the accurate height of ground objects along the road, such as transmission poles and buildings. To ensure the safety of the UAV communication link, field detection of the communication coverage of the mobile base station is also carried out. A mobile base station in an open area (117.395427W, 39.546825N) that was not sheltered by buildings and conformed to the test rules (
Combined with the construction process of the air route network (
| Step | Key technology | Required elements | Optional | Required data processing |
|---|---|---|---|---|
| I | Hierarchi- | Road network: urban expressway, urban main road, community or campus internal trunk road | Roads around buildings within a community or campus. | Road network: extract the road area and its center line and measure the road width. The road is stored in the form of shapefile. A road is a record composed of the coordinate values of feature points. |
| II | Utilizing positive constraints | None. | Urban green belt, isolation belt, grassland, street trees, parks, and other green areas; rivers, large areas of waters, ditches, and other water sources. | Green space: the relative position with the road determines the translation direction and translation distance, and thus the direction and translation distance matrices. |
| III | Avoiding negative constraints | General obstacles: buildings, mobile base station tower poles, street lamps, power lines (poles), etc. | Other obstacles, such as terrain in constructing the route in mountainous areas. | Mobile base station: the clearance boundary modeling of the tower pole is used to build an “obstacle” environment, and the communication coverage is modeled to analyze the spatial signal distribution. |
Table 1.
The minimum general element set for the iterative construction process of regional air route network
![]()
Figure 1.
3 Methods and implementation
Based on UAV remote sensing images and LiDAR point cloud data, this paper extracts constraints on the air routes and constructs the planning environment, including the favorable space, obstacle space and communication space, etc., by mathematical modelling combined with the measured data and gridding technology. We then iteratively construct the low-altitude air route network by utilizing positive constraints, avoiding negative constraints, and optimizing the path. Specific methods and implementation are shown as
![]()
Figure 2.
3.1 Construction of path planning environment
In order to ensure UAV flying safety, it is necessary to pre-construct the low-altitude environment, which includes defining the path planning space, modelling flight constraints, and mapping the physical obstacle space into the gridding space.
(1) Path planning space
The safety of UAV flights are greatly affected by communication links; mobile communication is the foundation of networked UAVs (
![]()
Figure 3.
(2) Obstacle and communication space for UAV operation
The geographical elements restricting the low-altitude UAV flight mainly include physical obstacles, such as buildings, transmission poles, mountains, and virtual obstacle spaces such as weak signal zones, electromagnetic danger zones and extreme weather zones. However, JJXC is characterized by flat terrain, non-significant climate change, and is mainly dominated by residential areas without electromagnetic danger zones. Therefore, this study only models and analyzes the distribution of mobile communications, buildings, and transmission poles.
The buildings in the study area are mainly single-family villas and middle and high-rise residential buildings, with relatively regular shapes. To simplify the calculation, the smallest external cuboid is used to represent the high-rise buildings. Transmission poles, street lamps and mobile tower poles are represented by a grid in the calculated environment map due to their small floor space. According to statistics, a total of 17 mobile communication base stations are evenly distributed around the residential areas and schools in the concerned area. The single base station channel model is constructed as follows by using the cellular network signal path loss formula published by the Third Generation Partnership Project (3GPP) (
where
According to the signal grading standard of China Mobile-LTE field test specification (
![]()
Figure 4.
![]()
Figure 5.
The minimum gridding cell was set to 1 m × 1 m; the distribution of mobile communication signals at different elevations and buildings and other ground objects were transformed into grid sets to construct the multi-attribute gridding environment map. The raster attribute corresponding to the obstacle was the height value; the raster attribute corresponding to the communication was the classification standard.
3.2 Iterative construction of air route network
(1) Class I air route network constructed by hierarchical classification
Urban road network planning has been developed for several decades, which divides urban roads into expressway, main and secondary trunk roads, and branch networks. Among them, expressway connects with urban entrances and exits and municipal high-grade highways to undertake inter-city traffic. The primary and secondary trunk roads are the evaluation components of the urban road network, and are the traffic arteries connecting the main districts of the city. Branch network is the connecting line between sub-trunk road and the inner road of residential area and other units, which is responsible for the internal traffic of units (
Referring to the planning experience of urban road network, and in order to efficiently utilize the low-altitude airspace in the urban area, and to orderly and safely regulate UAV operations, this paper classifies the air route into three categories according to its height stratification and function characteristics (
| Types | Function | Constraints | Height (m) | Minimum height (m) | Platform |
|---|---|---|---|---|---|
| 1 | Connecting urban areas with the outside area | Higher than most of ground objects in urban area | 70-300 | 70 | Fixed wing/multi- rotor UAV |
| 2 | Main traffic routes inside the urban areas | Higher than lamps, trees, and buildings along roads | 50-70 | 50 | Multi-rotor UAV |
| 3 | Internal air route of community units in urban area | None | 15-50 | 30 | Multi-rotor UAV |
Table 2.
Air route classification and relative attributes in JJXC district (Xu et al., 2020)
(2) Class II air route network constructed by utilizing favorable space
Based on the results of the class I air route, the class II route network is constructed by making full use of the favorable geographical space available for UAV’s low-altitude flights. In this paper, the space over green land and water area along roads in JJXC district are utilized and are taken into constructing progress of the class II air route network.
Firstly, a direction matrix is constructed according to the positional relationship between the green space, water area and road, based on the ground object distribution (
![]()
Figure 6.
Secondly, the class I air route is simplified as a network composed of the road centerline. Then the centerline is divided into several straight segments in the abrupt slope points by detecting its slope change. Thus, the class I air route consists of a series of ordered points. Based on this, a new path is formed by moving the straight segments along the normal line according to the direction and distance matrices by the edge expansion algorithm. Based on the endpoint coordinates, the direction and distance matrices, the new path is calculated by the following formulas:
where $({{x}_{i}},{{y}_{i}}),({{x}_{i+1,}}{{y}_{i+1}})$ is the ordered point coordinates of the moved path;${{\theta }_{1}}\times {{\theta }_{2}}$= -1 ensures that the movement is along the normal line; $~({{P}_{j}}(i,1),{{P}_{j}}(i,2)),({{P}_{j}}(i+1,1),{{P}_{j}}(i+$ $1,2))$ is the ordered coordinate of the
Finally, the performance of the UAV requires a continuous curvature of air routes to ensure flight safety. The paths are smoothed by cubic non-uniform B-spline technology (
![]()
Figure 7.
(3) Class III air route network constructed by avoiding obstacle space
Obstacles (buildings and transmission poles) are not considered when constructing the class II air route network, and the UAV may pass through the obstacles during flights, thus causing severe damage. Additionally, communication security is also an important prerequisite for safe UAV flight and supervision. Therefore, UAV obstacle avoidance and communication security are considered in this part.
Based on gridding maps at different heights, hierarchical planning was carried out, i.e., the type 1 air route network was planned within the 80-300 m height range, the type 2 air route network within the 50-80 m range and the type 3 air route network within the 30-50 m range. Other parameters for each type of air route network are set as follows: the minimum height is 80, 50, and 30 m, respectively; both the width and safe buffer distance of the air route are 1 m. To efficiently plan the path, the 2D flight path planning in the plane at the specific height was undertaken, along with the 3D path planning based on the terrain and UAV pitch performance (
![]()
Figure 8.
1) Collision detection
The calculated index space (
2) Re-planning of air route
After inputting
In the IACO algorithm, parameters are set as follows: the pheromone factor α is 2, heuristic factor score β is 5, increased intensity
where
3) Terrain following
The terrain following planning is carried out according to the terrain and UAV pitching performance, and the path optimization is then carried out to obtain the class III air route network (
![]()
Figure 9.
(4) Network capability assessment
The network capability highlights the structural characteristics of the air route network. It is measured by calculating the cross-conflict coefficient as follows, reflecting the conflict risk of the UAV at the intersection.
where
3.3 Risk assessment index
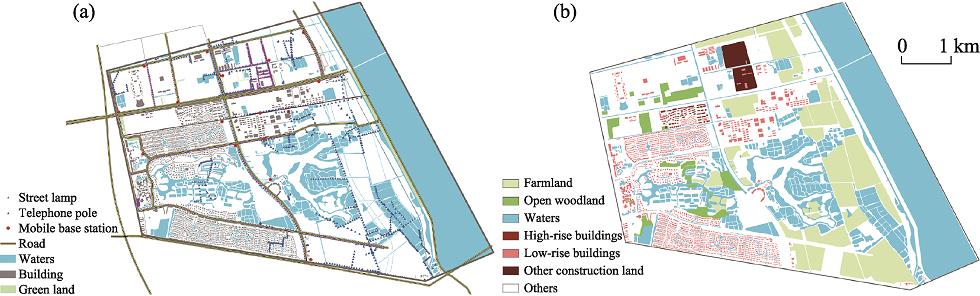
Public safety is the primary concern of UAV operations at low altitudes. Therefore, this study assesses the air route network by calculating the population exposure risk index (PERI). Firstly, the sheltering factor value for each type of land for UAV impact is based on the land use classification data and land classification criteria (as presented in
| Code | Type | Sheltering factor |
|---|---|---|
| 12 | Farmland | 0 |
| 23 | Open woodland (canopy density 10%-30%) | 2.5 |
| 41 | Waters | 0 |
| 51 | High-rise buildings | 7.5 |
| 52 | Low-rise buildings | 5 |
| 53 | Other construction land: factories and mines, large industrial zones, oil fields, salt fields, quarries and other patches of land; traffic roads, airports, and special areas | 10 |
| 61 | Others, including of unexploited land (e.g., deserts, salt flats, marshes) | 0 |
Table 3.
Sheltering factor for each type of land use
where
According to the single-person exposure model proposed by
The preliminary results of the population exposure risk value in the study area are shown in
![]()
Figure 10.
4 Results and analysis
4.1 Air route network
![]()
Figure 11.
There is no obvious difference among each level of air route network in the global figure (
![]()
Figure 12.
4.2 Risk assessment
| Type | Population exposure risk index (PERI) | |||||
|---|---|---|---|---|---|---|
| Average | Variance | Average | Variance | Average | Variance | |
| Type 1 | Type 2 | Type 3 | ||||
| Class I | 62.42 | 62.92 | 158 | 0 | 117.47 | 62.14 |
| Class II | 21.75 | 9.05 | 25.98 | 15.35 | 23.92 | 17.88 |
| Class III | 21.74 | 8.89 | 25.06 | 14.05 | 25.37 | 22.17 |
Table 4.
Comparison of the population exposure risk for iterative UAV low-altitude air route network
The risk was greatly reduced from class I to class II air route network in particular; thus, UAV operation safety is guaranteed. We found that the class I air route network is located directly above roads with many pedestrians, vehicles, and populations without shelter. Secondary damage can easily on the ground once the UAV fails. Class II construction is carried out over green land and water area along roads, which not only avoids the secondary ground damage caused by UAV failure but also provides services for UAV operation in terms of making ground road facilities nearby available for use.
The difference in the risk between class II and III is not obvious; sometimes, the value of the class III risk is greater than that of class II, such as for the type 3 air route network (17.88 and 22.17). As more than 80% of buildings in the study area are lower than 30 m, which is the minimum height of the type 3 air route network, the collision probability is very low. Even if re-planning can significantly reduce the risk, there is no obvious risk reduction except from the viewpoint of overall risk due to the low probability of collision. Additionally, smooth optimization is carried out to make the air route conform to the kinetic characteristics of the UAV for the class III air route network. In the process of smoothing, it is inevitable that the air route would cross part of a road, thus leading to increased risk. Therefore, the population exposure risk of the class III air route network is slightly higher than that of class II.
However, from the perspective of overall risk, the class III air route network avoids the collision and flight dynamic risks and is thus more optimal than class II.
Additionally, the path from the UAV integrated verification field to the Hyatt hotel was taken as an example to assess the air route network. A method proposed by
![]()
Figure 13.
5 Discussion and limitation
5.1 Air route planning environment
Flight environment construction is the precondition of air route planning. Although UAV flight constraints are numerous, two categories can be distinguished by their effects: positive constraints and negative constraints. The positive constraint refers to elements that benefit the UAV flight (e.g., space above the green land). Conversely, the negative constraint refers to elements that restrict the UAV flight, including physical obstacles such as buildings and virtual obstacle space (e.g., electromagnetic zones). The positive and negative constraints are not opposite. Some elements may be attributable to any category according to the dividing principle. In the case of communication, it is a positive constraint from its positive influence; however, it can be a negative constraint when considering its weak-signal area (
To utilize infrastructure and geographic information in an efficient way that allows classification, our study divided the UAV flying environment into the favorable space, obstacle space and communication space. When building the planning environment, the height range was delimited for each level of the air route based on the feature height count by the principle of zero risk of cross-collision on different levels of the air route. Different air route levels are at different heights, and there are isolation layers between each level. In the construction of low-altitude mobile communication environment, the UAV is used to measure the signal distribution of the single base station with a flight height greater than 30 m to ensure flight safety in the experiment. Therefore, the ground signal distribution is not included in the measured RSRP value, and the established channel modeling thus lacks the sheltering factor effect such as the near-ground buildings. Referring to the research conducted by
Furthermore, as UAV flight constraints are numerous, as well as in rich sources and at diverse scales, artificial extraction method is not suitable for application in large areas. It is necessary to construct a process to automatically or semi-automatically extract the sensitive geographical elements based on the UAV remote sensing images. This includes quickly acquiring and updating constraints of the large-range and high-precision air route network based on the UAV remote sensing network with multi-platforms and multi-sensors (
5.2 Air route network
The iterative construction of the air route network proposed in this study is an innovative technology. Under the background of numerous constraints, constructing each step of the air route network can classifiably and efficiently utilize ground infrastructure and geographic information. Additionally, the iterative construction decomposes and then utilizes the constraints to facilitate the decomposition of the air route assessment and verification indicators, gradually achieving the goal of the air route as “flyable.” Risk assessment results also indicated that the PERI of the air route network gradually reduces and stabilizes, especially from class I to class II with the iterative construction by making full use of the favorable space and avoiding obstacles. This greatly ensures the safety of UAV operations.
From the perspective of urban planning, most of the buildings may not exceed the building lines or boundary lines of roads (The Government of Tianjin, 2009). Therefore, the risk of collision between UAVs and buildings hardly occur in the class II air route network. However, this situation is not applicable inside the community. There are some class II air route segments that may pass through buildings (
![]()
Figure 14.
There are many limitations in the iterative construction process of the air route network. JJXC is a plain area and a typical suburban area of the city, where buildings are mainly residential with low floors. Therefore, this research characterizes the strong regional features. In the class I air route network construction, height for each type of air route is based on the statistical height of ground objects and the distance and direction matrices in the construction of the class II air route are based on the actual survey of the relative positions between roads, and green land and rivers. The communication channel model and regional signal distribution involved in the construction of the class III air route have strong regional characteristics, which will cause certain restrictions on the promotion of research.
Secondly, this paper has not considered other attributes of low-altitude air routes of UAVs (the channel numbers and course, route spacing, etc.), and has not further designed the network connection (airspace connections between various types of air routes and UAV transition, etc.). In future research, we plan to explore the structural optimization of the low-altitude airspace, and to obtain attributes that conform to the regional characteristics and meet the dynamic performance of UAVs by resource quantitative calculation. This includes construction of a quantitative function between the route attribute and the low-altitude resource utilization by calculating the low-altitude resource utilization through the airspace throughput (
Finally, this study merely assesses the result from the theoretical view based on the population exposure risk index. The air route network is still far from being applicable in JJXC. Our team has been funded by the key deployment project of the Chinese Academy of Sciences - “Low-altitude UAV public air route planning and simulation verification system” project. With the support of the project, the simulated flight test and actual flight verification of the UAV in this study area will be conducted to ensure reasonability, high reliability, and practical applicability of the planned air route network.
6 Conclusions
Based on the theoretical system and technical pathway of the low-altitude UAV public air route network in urban areas proposed in earlier research, this paper further deepens and improves the research. It proposed a minimum general element set for constructing low-altitude UAV air route network and constructed a planning environment. This consisted of the favorable space, obstacle space, and communication space, by establishing a channel model and regional signal coverage of mobile base stations. It then iteratively constructed a low-altitude air route network that meets the UAV dynamic characteristics and assessed the network structure and safety by calculating the population exposure risk values. It forms a complete iterative construction pathway of regional air route network and obtains the preliminary feasible results through the actual case planning and evaluation. It provides a new idea for the coordination and integrated development of the ground road network and the UAV low-altitude air route network, and also provides a feasible way for the construction of the UAV logistics air route network based on the existing ground transportation infrastructure in local areas. The main conclusions are as follows:
Firstly, compared with free flights over urban areas, the risk of UAV operation is significantly reduced after the establishment of a low-altitude air route network, especially the secondary damage to vehicles along the road and the public in densely populated areas;
Secondly, the risk from class I to class III air route networks gradually reduced, indicating that each step of the iterative construction can effectively improve the safety of the air network, and that the stepwise iterative technology path is feasible.
The proposed methods and initial air routes network in typical demonstration areas can be used as a normative reference for the planning of national UAV low-altitude air routes in urban areas and further promoting the development of the construction technology of air route networks in low-altitude three-dimensional traffic network system.
References
[2] Framework for urban Traffic Management of Unmanned Aircraft Systems (uTM-UAS)(2017).
[3] Modeling cellular-to-UAV path-loss for suburban environments. IEEE Wireless Communication Letter, 7, 82-85(2018).
[4] Drones are everywhere. Get used to it. Time, 22, 24-25(2018).
[5] et alRadio channel modeling for UAV communication over cellular networks. IEEE Wireless Communication Letter, 6, 514-517(2017).
[6] et alLow-altitude navigation for multi-rotor drones in urban areas. IEEE Access, 7, 87716-87731(2019).
[7] et alRules and methods of UAV activities’ aerial lanes design for (ultra) low airspace in regional areas. Advances in Earth Science, 31, 1197-1204(2016).
[8] U-Space Blueprint(2017). https://www.sesarju.eu/u-space-blueprint
[9] et alA throughput-based capacity metric for low-altitude airspace, 1-9(2018).
[10] Reference for route network planning methods(2009).
[13] et alRegulation analysis and new concept for a cloud-based UAV supervision system in urban environment, 90-95(2017).
[14] Acceptance specification on wireless engineering acceptance for TD-LTE system (1.0.0)(2012).
[15] Application of B-spline theory to UAV flight track smoothing. Wireless Internet Technology, 15, 141-144(2018).
[16] Construction of aircraft traffic management platform for low altitude security based on three dimensional digital aerial corridor. Computer Measurement & Control, 25, 137-140, 161(2017).
[17] et alResearch on city chart drawing in low altitude airspace based on three-dimensional visualization of aerial corridor. Journal of Electronic Measurement and Instrumentation, 32, 58-64(2018).
[18] Automatic construction of aerial corridor for navigation of unmanned aircraft systems in class G airspace using LiDAR. Airborne Intelligence, Surveillance, Reconnaissance (ISR) Systems and Applications XIII, 9828, 1-8(2016).
[19] Science, technology and the future of small autonomous drones. Nature, 521, 460-466(2015).
[20] et alUAV for mapping historic buildings: From 3D modelling to BIM. ISPRS - International Archives of the Photogrammetry, Remote Sensing and Spatial Information Sciences,, 397-402(2019).
[21] et alUnmanned Aircraft System Traffic Management (UTM) Concept of Operations, 1-16(2016).
[22] Research on UAV low-altitude public air route planning based on geographic information, 45-49(2018).
[23] et alThree-dimensional (3D) dynamic obstacle perception in a detect-and-avoid framework for unmanned aerial vehicles, 988-996(2019).
[24] et alThe Sky is not the limit: LTE for unmanned aerial vehicles. IEEE Communication Magazine, 56, 204-210(2018).
[25] et alUAV-enabled intelligent transportation systems for the smart city: Applications and challenges. IEEE Communication Magazine, 55, 22-28(2017).
[27] Low altitude UAV traffic management: An introductory overview and proposal. Acta Aeronautica et Astronautica Sinica, 41, 6-34(2020).
[28] et alPreliminary concept of adaptive urban airspace management for unmanned aircraft operations, 1-12(2018).
[31] et alStudy on impact of separation distance to traffic management for small UAS operations in urban environment, 5, 39-45(2017).
[32] et alEvolutionary optimization-based mission planning for UAS traffic management (UTM). 2019. International Conference on Unmanned Aircraft Systems (ICUAS), 944-950(2019).
[33] Technical regulations on urban planning and management in Tianjin, China(2009).
[34] et alImpact of sensors on collision risk prediction for non-cooperative traffic in terminal airspace, 177-185(2018).
[35] Transportation Planning(2017).
[36] et al3-D path-searching for UAVs using geographical spatial information. IEEE International Geoscience and Remote Sensing Symposium, 947-950(2019).
[37] et alConstruction of a UAV low-altitude public air route based on an improved ant colony algorithm. Journal of Geo-information Science, 21, 570-579(2019).
[38] et alResearch on iterative construction of UAV low-altitude air route network in urbanization region: Theoretical system and technical roadmap. Acta Geographica Sinica, 75, 917-930(2020).
[39] et alThe impact of UAV remote sensing technology on the industrial development of China: A review. Journal of Geo-information Science, 21, 476-495(2019).
[40] et alResearch on urban application-oriented route planning of UAV based on mobile communication network, 1562-1570(2015).


Set citation alerts for the article
Please enter your email address

© Copyright 2018-2021 | Chinese Laser Press. All Rights Reserved 沪ICP备15018463号-20