
Shichao Chen, Huayang Dai, Cheng Wang, Xiaohuan Xi, Li Guan. Method for Filtering Dense Noise from Laser Scanning Data[J]. Laser & Optoelectronics Progress, 2019, 56(6): 062801
- Laser & Optoelectronics Progress
- Vol. 56, Issue 6, 062801 (2019)
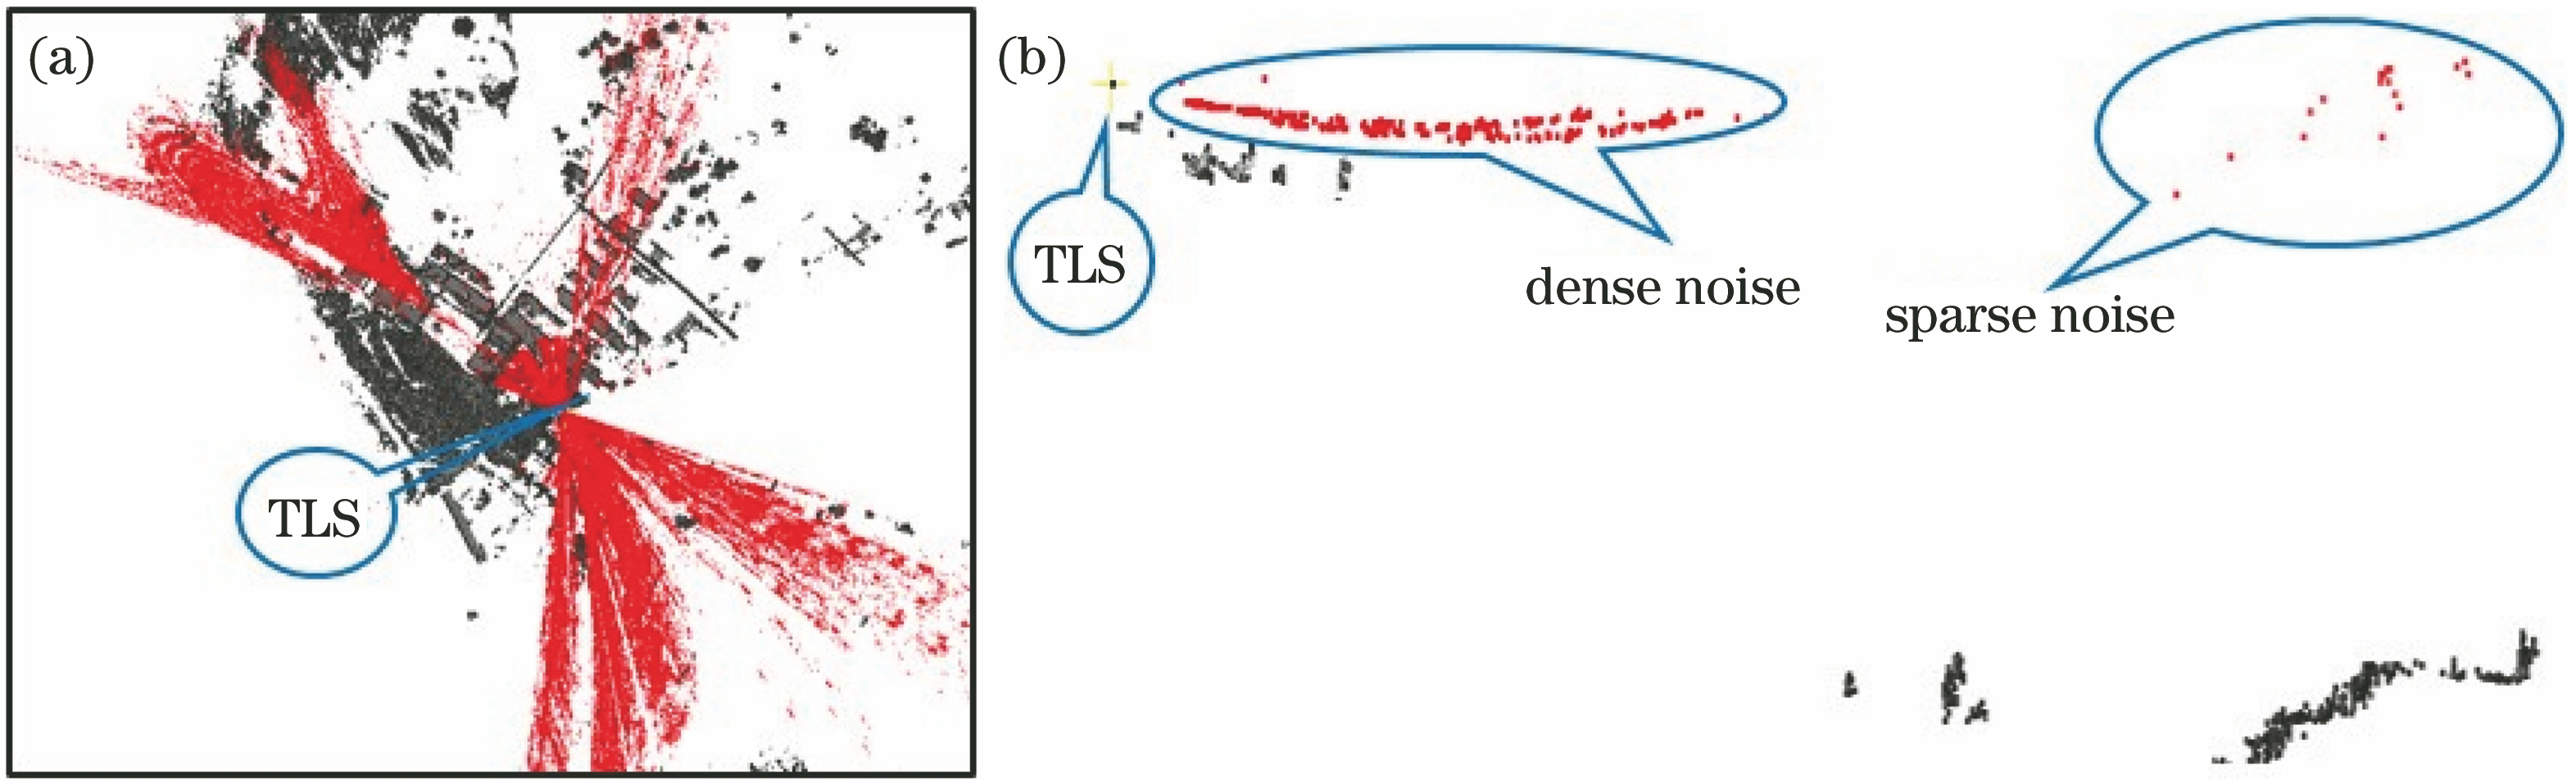
Fig. 1. Spatial distribution of noise. (a) Point clouds data nearby TLS; (b) vertical profile along one direction
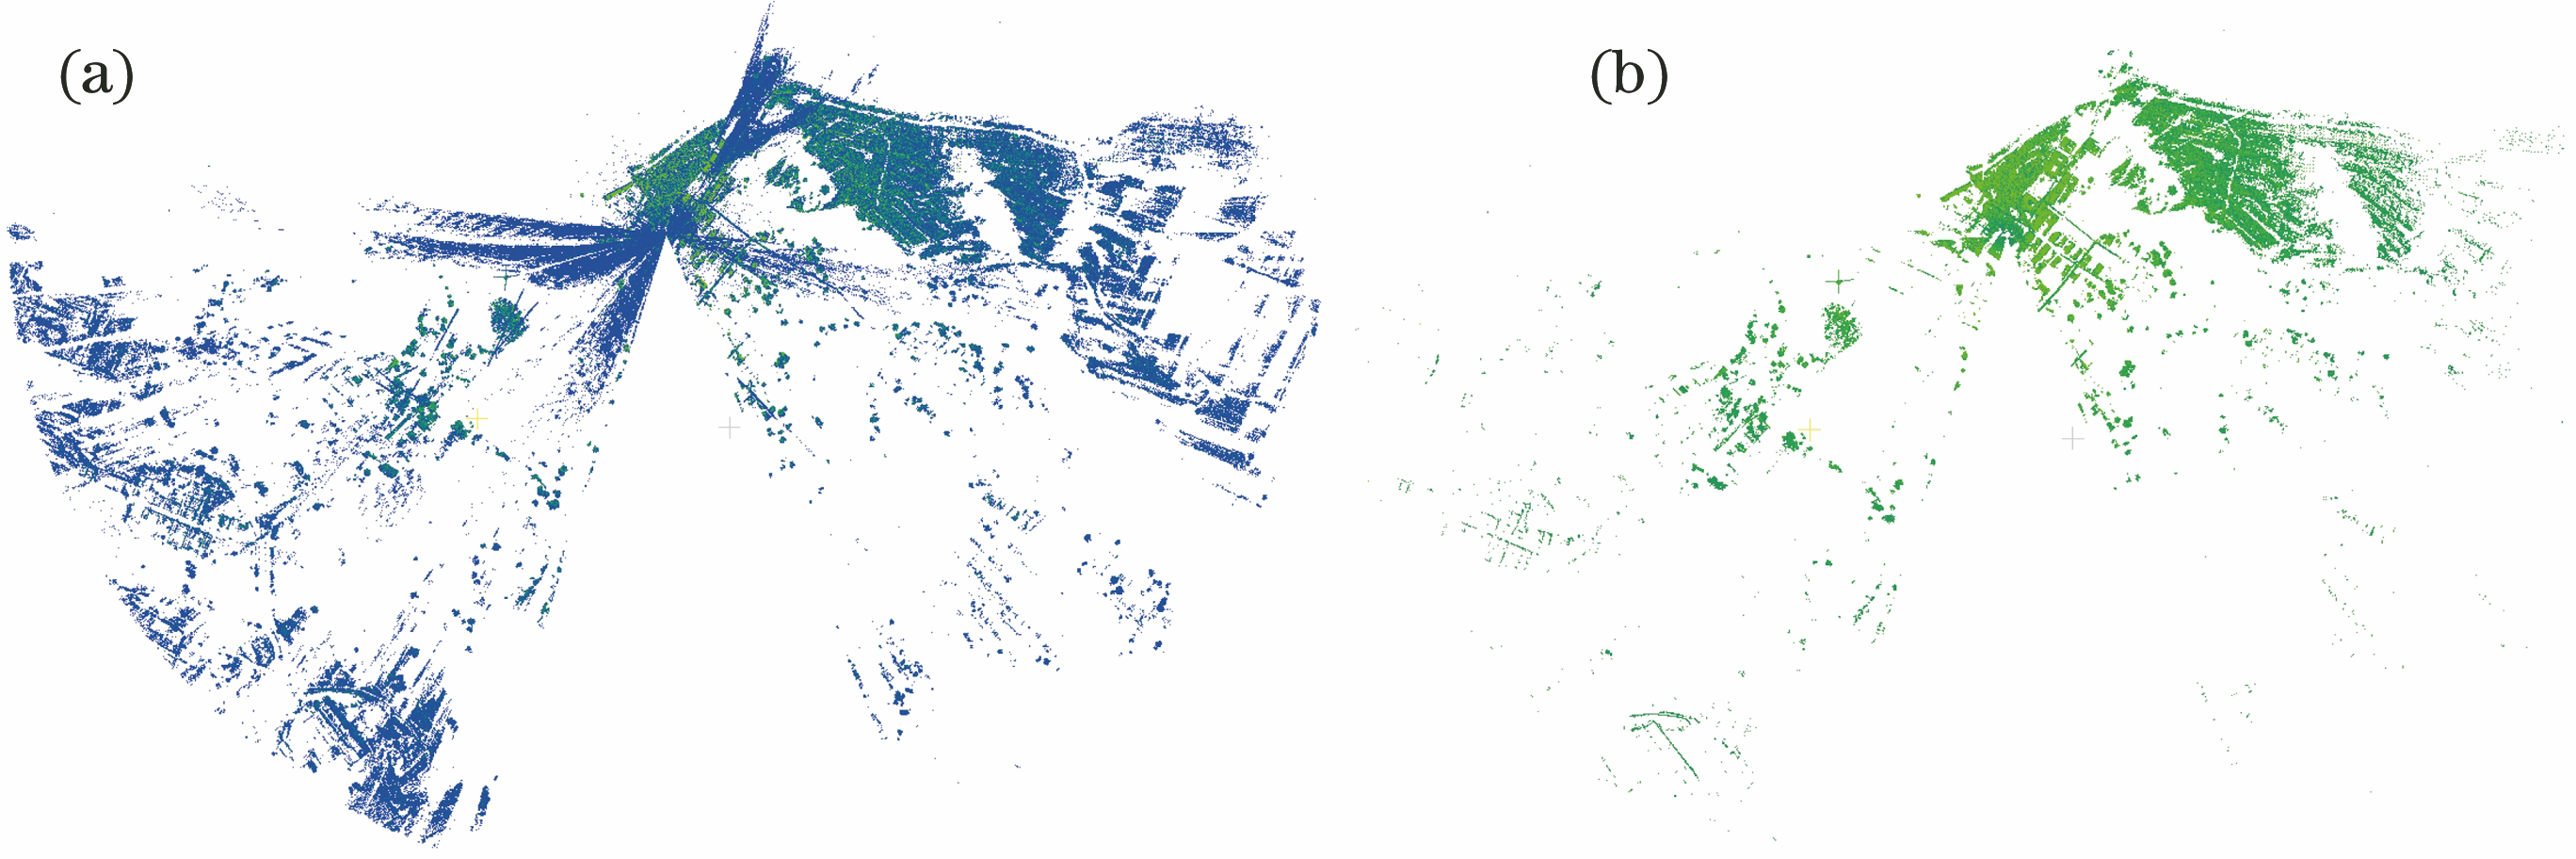
Fig. 2. Intensity map of point cloud. (a) All point clouds; (b) point clouds after points with intensity less than 2σ removed
Fig. 3. Flow chart of point cloud denoising algorithm
Fig. 4. Denoising results for all point clouds. (a) Data 1, original data; (b)data 1, Cloud compare; (c) data 1, statistical filter & radius filter; (d) data 1, proposed method; (e) data 2, original data; (f) data 2, Cloud compare; (g) data 2, statistical filter & radius filter; (f) data 2, proposed method
Fig. 5. Denoising results for edges of partial buildings and partial electric wires from data 1. (a) Original data; (b) Cloud compare; (c) statistical filter & radius filter; (d) proposed method
Fig. 6. Denoising results for edges of partial buildings and partial electric wires from data 2. (a) Original data; (b) Cloud compare; (c) statistical filter & radius filter; (d) proposed method
| |||||||||||||||||||||||||||||||||||||||||||||||
Table 1. Parameters for proposed method and Cloud compare software
| ||||||||||||||||||||||||||||||||||||||||||||||||||||||||||||||||||||||||||||||||||||||||||||||||||||||||||||||||||||||||||
Table 2. Denoising accuracy of proposed method, statistical filter & radius filter and Cloud compare
| |||||||||||||||||||||||||||
Table 3. Operation efficiency and ratio of number of denoised points to original points of proposed method, statistical filter & radius filter and Cloud compare

Set citation alerts for the article
Please enter your email address
© Copyright 2018-2021 | Chinese Laser Press. All Rights Reserved 沪ICP备15018463号-20