• Spectroscopy and Spectral Analysis
  • Vol. 40, Issue 10, 3061 (2020)
Jing LIU1、1, Hai-shun LIU1、1, Jian ZUO1、1, Cun-lin ZHANG1、1, Yue-jin ZHAO1、1, and Mei-yan LIANG1、1
Author Affiliations
  • 1[in Chinese]
  • 11. School of Optoelectronics, Beijing Institute of Technology, Beijing 100081, China
  • show less
    DOI: 10.3964/j.issn.1000-0593(2020)10-3061-05 Cite this Article
    Jing LIU, Hai-shun LIU, Jian ZUO, Cun-lin ZHANG, Yue-jin ZHAO, Mei-yan LIANG. Terahertz Spectrum Analysis for Binary Amino Acids Mixture Based on Empirical Mode Decomposition[J]. Spectroscopy and Spectral Analysis, 2020, 40(10): 3061 Copy Citation Text show less
    Flowchart of EMD-PLS modeling
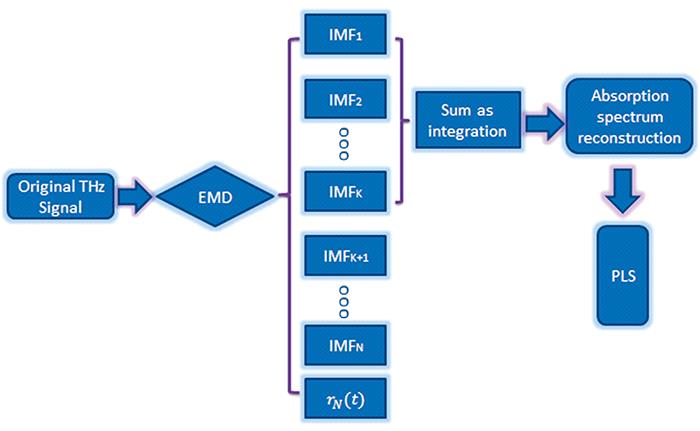
    Fig. 1. Flowchart of EMD-PLS modeling
    (a) 28 original temporal signals and (b) absorption spectra of 28 original amino acids samples
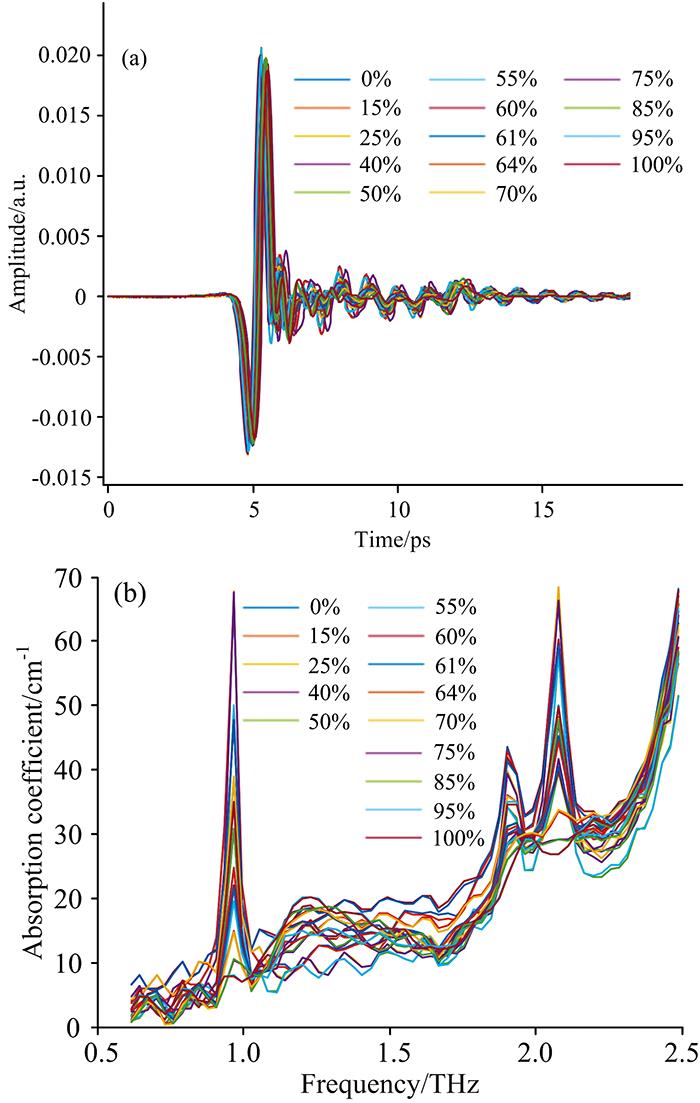
    Fig. 2. (a) 28 original temporal signals and (b) absorption spectra of 28 original amino acids samples
    EMD decomposed IMFs and residual function of concentration=0% sample
    Fig. 3. EMD decomposed IMFs and residual function of concentration=0% sample
    The corresponding absorption spectra of concentration=0% sample for the first one IMFs (IMF1), two IMFs superposition (IMF1+IMF2), three IMFs superposition (IMF1+IMF2+IMF3), four IMFs superposition (IMF1+IMF2+IMF3+IMF4) and five IMFs superposition (IMF1+IMF2+IMF3+IMF4+IMF5)
    Fig. 4. The corresponding absorption spectra of concentration=0% sample for the first one IMFs (IMF1), two IMFs superposition (IMF1+IMF2), three IMFs superposition (IMF1+IMF2+IMF3), four IMFs superposition (IMF1+IMF2+IMF3+IMF4) and five IMFs superposition (IMF1+IMF2+IMF3+IMF4+IMF5)
    Scatter plots of the actual concentration versus the predicted concentration using (a) PLS model and (b) EMD-PLS model (IMF1+IMF2+IMF3+IMF4) for different concentrations of amino acids mixture samples
    Fig. 5. Scatter plots of the actual concentration versus the predicted concentration using (a) PLS model and (b) EMD-PLS model (IMF1+IMF2+IMF3+IMF4) for different concentrations of amino acids mixture samples
    Signal componentsRcalRMSEC
    /%
    RpRMSEP
    /%
    Original signal0.994 60.021 80.990 00.025 1
    IMF1+IMF20.993 20.021 70.991 70.029 0
    IMF1+IMF2+IMF30.995 20.019 20.993 70.022 4
    IMF1+IMF2+IMF3+IMF40.999 40.006 80.996 10.019 8
    IMF1+IMF2+IMF3+IMF4+IMF51.000 00.000 50.990 90.033 0
    Table 1. PLS calibration and prediction performance statistics for binary mixtures
    Jing LIU, Hai-shun LIU, Jian ZUO, Cun-lin ZHANG, Yue-jin ZHAO, Mei-yan LIANG. Terahertz Spectrum Analysis for Binary Amino Acids Mixture Based on Empirical Mode Decomposition[J]. Spectroscopy and Spectral Analysis, 2020, 40(10): 3061
    Download Citation