• Acta Optica Sinica
  • Vol. 38, Issue 11, 1112003 (2018)
Kuang Peng1、*, Yiping Cao2、*, and Yingchun Wu3
Author Affiliations
  • 1 Hubei Provincial Key Laboratory of Ferro & Piezoelectric Materials and Devices, Faculty of Physics & Electronic Sciences, Hubei University, Wuhan, Hubei 430062, China;
  • 2 Department of Opto-Electronic Science & Technology, Sichuan University, Chengdu, Sichuan 610064, China;
  • 3 School of Electronic and Information Engineering, Taiyuan University of Science and Technology, Taiyuan, Shanxi 0 30024, China
  • show less
    DOI: 10.3788/AOS201838.1112003 Cite this Article Set citation alerts
    Kuang Peng, Yiping Cao, Yingchun Wu. An On-Line Three-Dimensional Measurement Method of Composite Grating Projection Without Filtering[J]. Acta Optica Sinica, 2018, 38(11): 1112003 Copy Citation Text show less
    Online 3D measurement system based on Stoilov algorithm
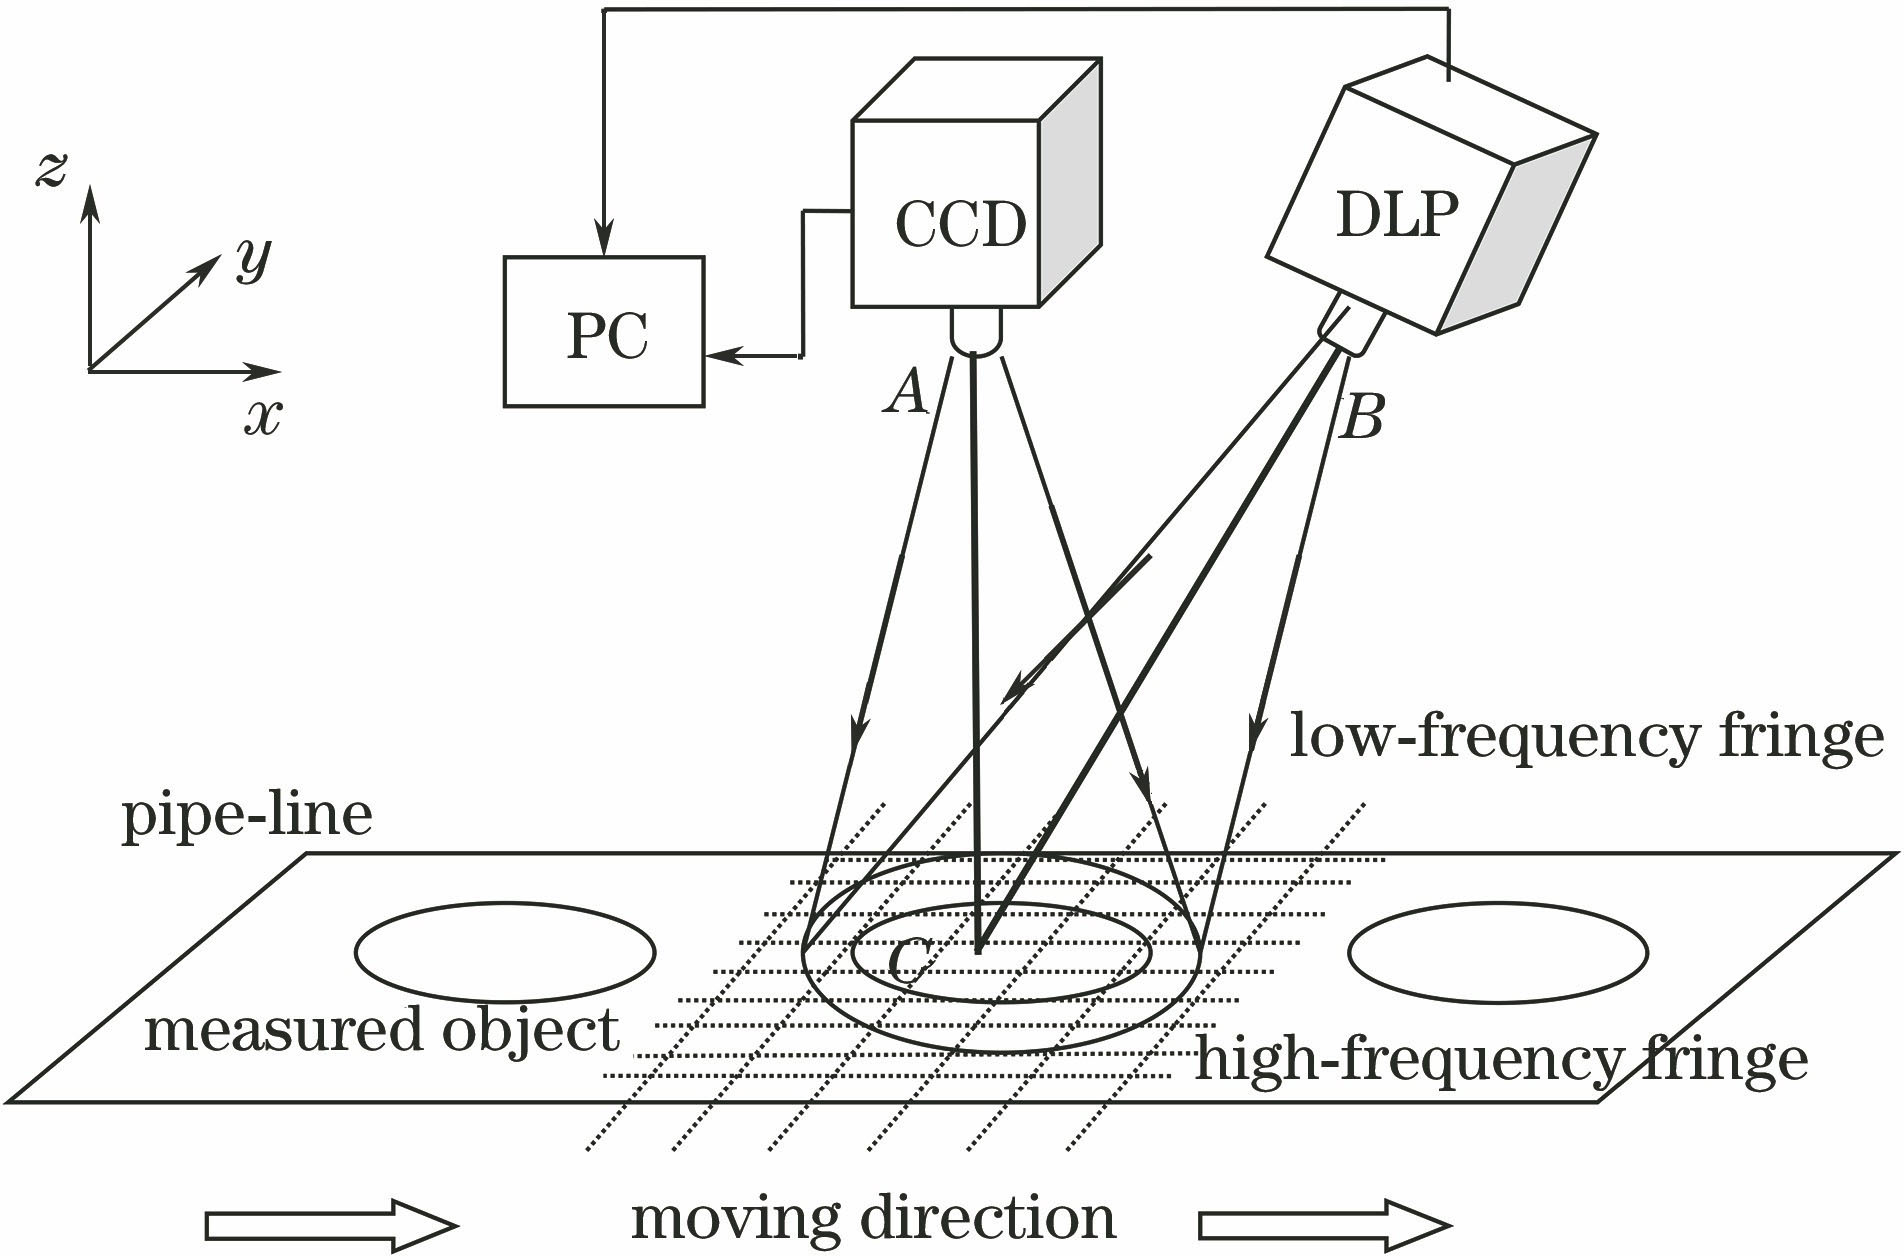
    Fig. 1. Online 3D measurement system based on Stoilov algorithm
    Original simulation data. (a) Measured object; (b) reflectance distribution; (c) the first deformed pattern I1(x,y); (d) the second deformed pattern I2(x,y)
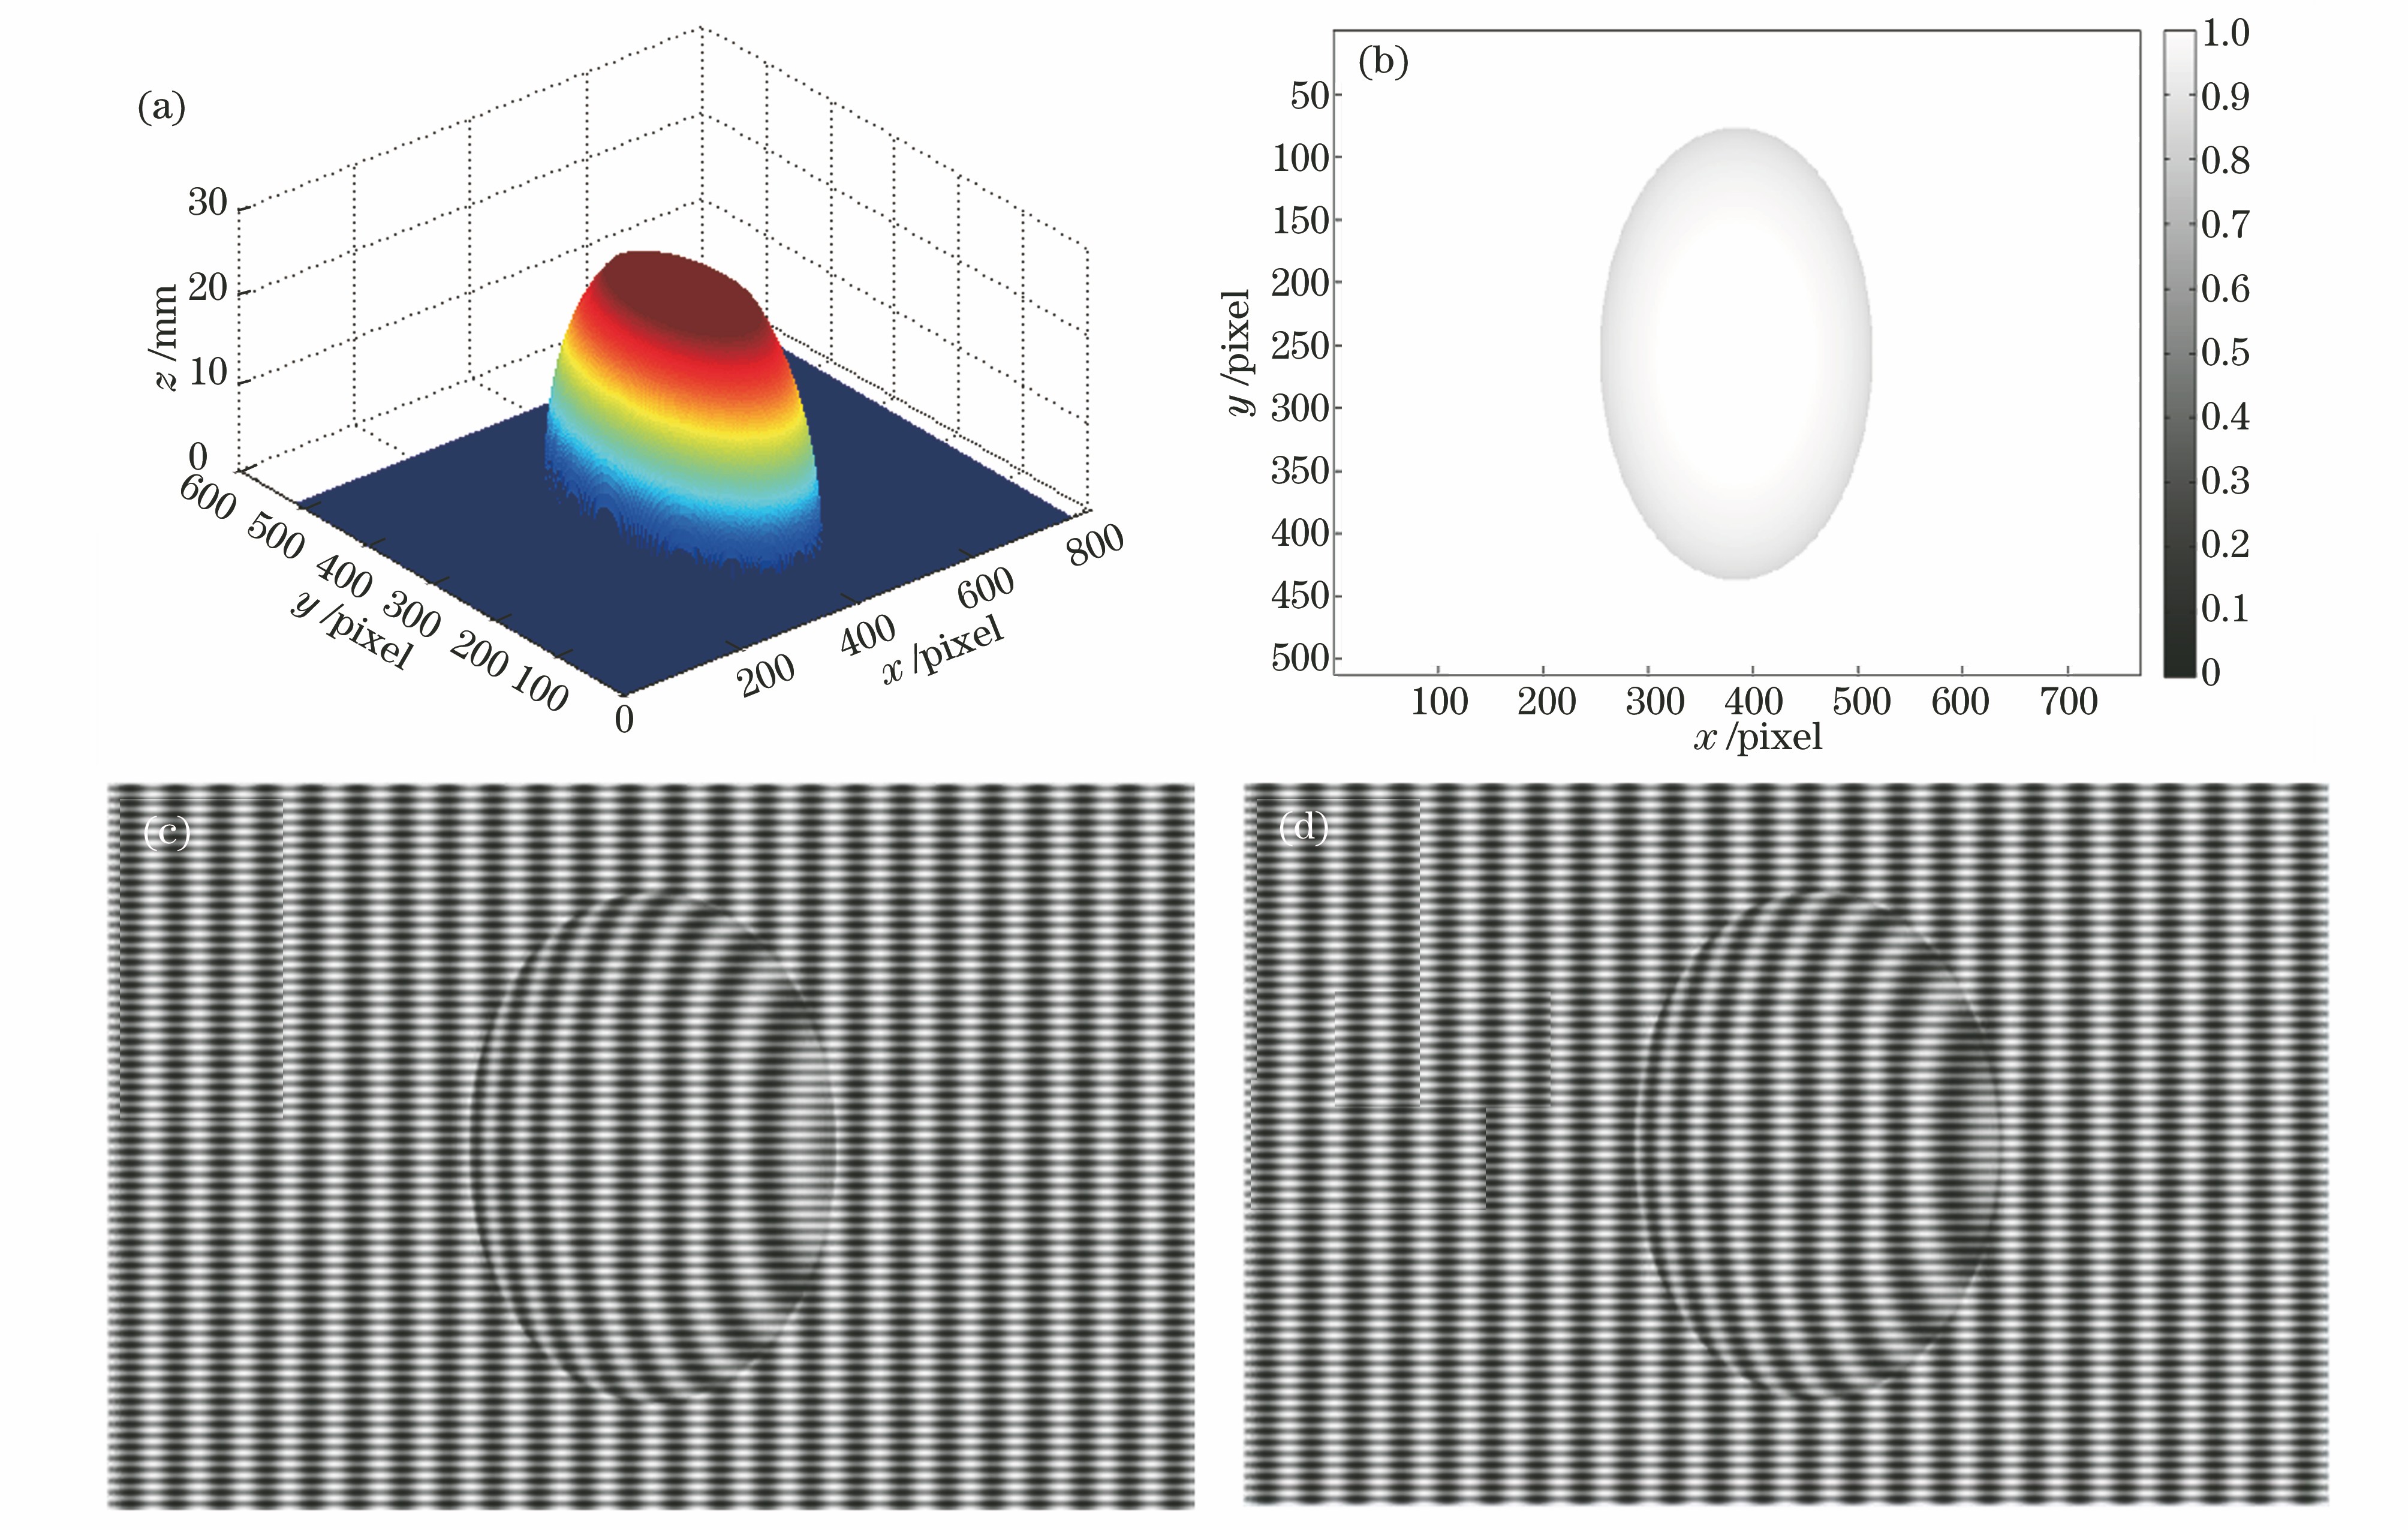
    Fig. 2. Original simulation data. (a) Measured object; (b) reflectance distribution; (c) the first deformed pattern I1(x,y); (d) the second deformed pattern I2(x,y)
    Extraction of the modulation patterns in the simulation. (a)Spectrum distribution of the composite dual-frequency deformed pattern; (b) area of the positive first-level frequency spectrum after filtering; (c) modulation pattern
    Fig. 3. Extraction of the modulation patterns in the simulation. (a)Spectrum distribution of the composite dual-frequency deformed pattern; (b) area of the positive first-level frequency spectrum after filtering; (c) modulation pattern
    Phase calculation directly after pixel matching in the simulation. (a) The first composite dual-frequency deformed pattern I'1(x,y) after pixel matching; (b) the second composite dual-frequency deformed pattern I'2(x,y) after pixel matching; (c) reconstructed object; (d) error distribution; (e) section cross at x=250 for the measured object and the reconstructed object; (f) section cross at y=250 for the measured object and the reconstructed object
    Fig. 4. Phase calculation directly after pixel matching in the simulation. (a) The first composite dual-frequency deformed pattern I'1(x,y) after pixel matching; (b) the second composite dual-frequency deformed pattern I'2(x,y) after pixel matching; (c) reconstructed object; (d) error distribution; (e) section cross at x=250 for the measured object and the reconstructed object; (f) section cross at y=250 for the measured object and the reconstructed object
    Phase calculation after filtering out the low-frequency component in the simulation. (a) Frequency spectrum distribution of the composite deformed pattern after pixel matching; (b) frequency spectrum area of the low-frequency component after filtering; (c) the first deformed pattern of the low-frequency component I'FL1(x,y); (d) the second deformed pattern of the low-frequency component I'FL2(x,y); (e) reconstructed object; (f) error distribution; (g) section cross at x=250 for the measured obje
    Fig. 5. Phase calculation after filtering out the low-frequency component in the simulation. (a) Frequency spectrum distribution of the composite deformed pattern after pixel matching; (b) frequency spectrum area of the low-frequency component after filtering; (c) the first deformed pattern of the low-frequency component I'FL1(x,y); (d) the second deformed pattern of the low-frequency component I'FL2(x,y); (e) reconstructed object; (f) error distribution; (g) section cross at x=250 for the measured obje
    Measured object and deformed patterns. (a) Measured object; (b) the first deformed pattern I1(x,y); (c) the second deformed pattern I2(x,y)
    Fig. 6. Measured object and deformed patterns. (a) Measured object; (b) the first deformed pattern I1(x,y); (c) the second deformed pattern I2(x,y)
    Measured object in the spectral distribution and the deformed patterns. (a) Measured object in the spectral distribution of the composite dual-frequency deformed pattern; (b) positive first-level frequency spectrum area of the high-frequency fringe after filtering; (c) modulation pattern
    Fig. 7. Measured object in the spectral distribution and the deformed patterns. (a) Measured object in the spectral distribution of the composite dual-frequency deformed pattern; (b) positive first-level frequency spectrum area of the high-frequency fringe after filtering; (c) modulation pattern
    3D reconstruction of the measured object. (a) The first composite dual-frequency deformed pattern I'1(x,y) after pixel matching; (b) the second composite dual-frequency deformed pattern I'2(x,y) after pixel matching; (c) reconstructed object; (d) cross section at y=340 for the reconstructed object by the proposed method and the filtering method
    Fig. 8. 3D reconstruction of the measured object. (a) The first composite dual-frequency deformed pattern I'1(x,y) after pixel matching; (b) the second composite dual-frequency deformed pattern I'2(x,y) after pixel matching; (c) reconstructed object; (d) cross section at y=340 for the reconstructed object by the proposed method and the filtering method
    ParameterMeasurement error
    3510
    Average height of measurement2.965.039.97
    RMS0.0720.0830.077
    Table 1. Measurement errors of planes with height of 3, 5 and 10 mm
    Kuang Peng, Yiping Cao, Yingchun Wu. An On-Line Three-Dimensional Measurement Method of Composite Grating Projection Without Filtering[J]. Acta Optica Sinica, 2018, 38(11): 1112003
    Download Citation