
Yu Zhang, Jie Ma, Jinwen Cui, Yuehua Zhao, Hong Liu. Rotation Target Detection Algorithm for Remote Sensing Image Using Attention Mechanism[J]. Laser & Optoelectronics Progress, 2022, 59(24): 2415005
- Laser & Optoelectronics Progress
- Vol. 59, Issue 24, 2415005 (2022)
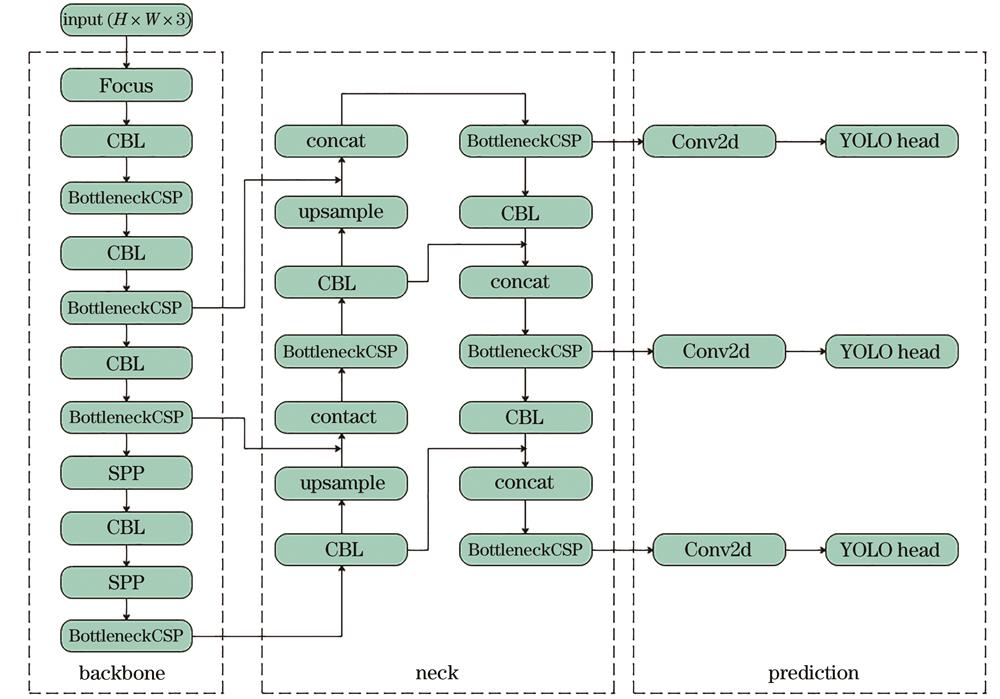
Fig. 1. YOLOv5 network structure
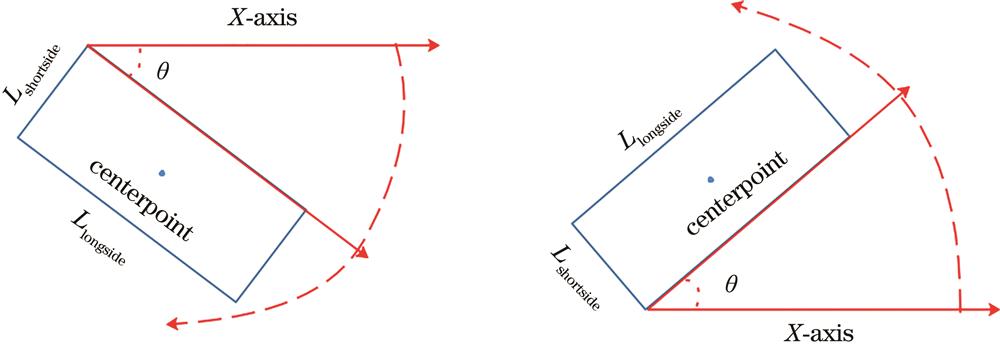
Fig. 2. Long edge definition method
Fig. 3. PSANeck structure
Fig. 4. PSA module structure
Fig. 5. ECALayer structure
Fig. 6. YOLOv5 PAN structure
Fig. 7. Improved feature fusion structure
Fig. 8. Densely coded label
Fig. 9. Improved network structure diagram
Fig. 10. YOLOv5m multi-scale characteristic thermodynamic diagram. (a) High resolution branch; (b) medium resolution branch; (c) low resolution branch
Fig. 11. Improved algorithm multiscale characteristic thermodynamic diagram. (a) High resolution branch; (b) medium resolution branch; (c) low resolution branch
Fig. 12. Comparison of detection effect between YOLOv5m and improved algorithm. (a)(b)(c) detection results of YOLOv5m algorithm; (d) (e) (f) detection results of improved algorithm
|
Table 1. Comparison of model performance under different angle discretization granularity
|
Table 2. Comparison of ablation experiments of each improved module
|
Table 3. Comparison of results of different algorithms on DOTA dataset subset
|
Table 4. Comparison of different algorithms on HRSC2016 ship dataset

Set citation alerts for the article
Please enter your email address
© Copyright 2018-2021 | Chinese Laser Press. All Rights Reserved 沪ICP备15018463号-20