

 )
)
 )
)

 )
)
 )
)


 )
)


 (keV) Si ,


 (keV)
(keV)


 )
)


 )
)


 )
)


 )
)


Lan Zhang, Feilu Wang, Xiangxiang Xue, Dawei Yuan, Huigang Wei, Gang Zhao. Physical parameter estimation with MCMC from observations of Vela X-1[J]. High Power Laser Science and Engineering, 2018, 6(2): 02000e37
- High Power Laser Science and Engineering
- Vol. 6, Issue 2, 02000e37 (2018)
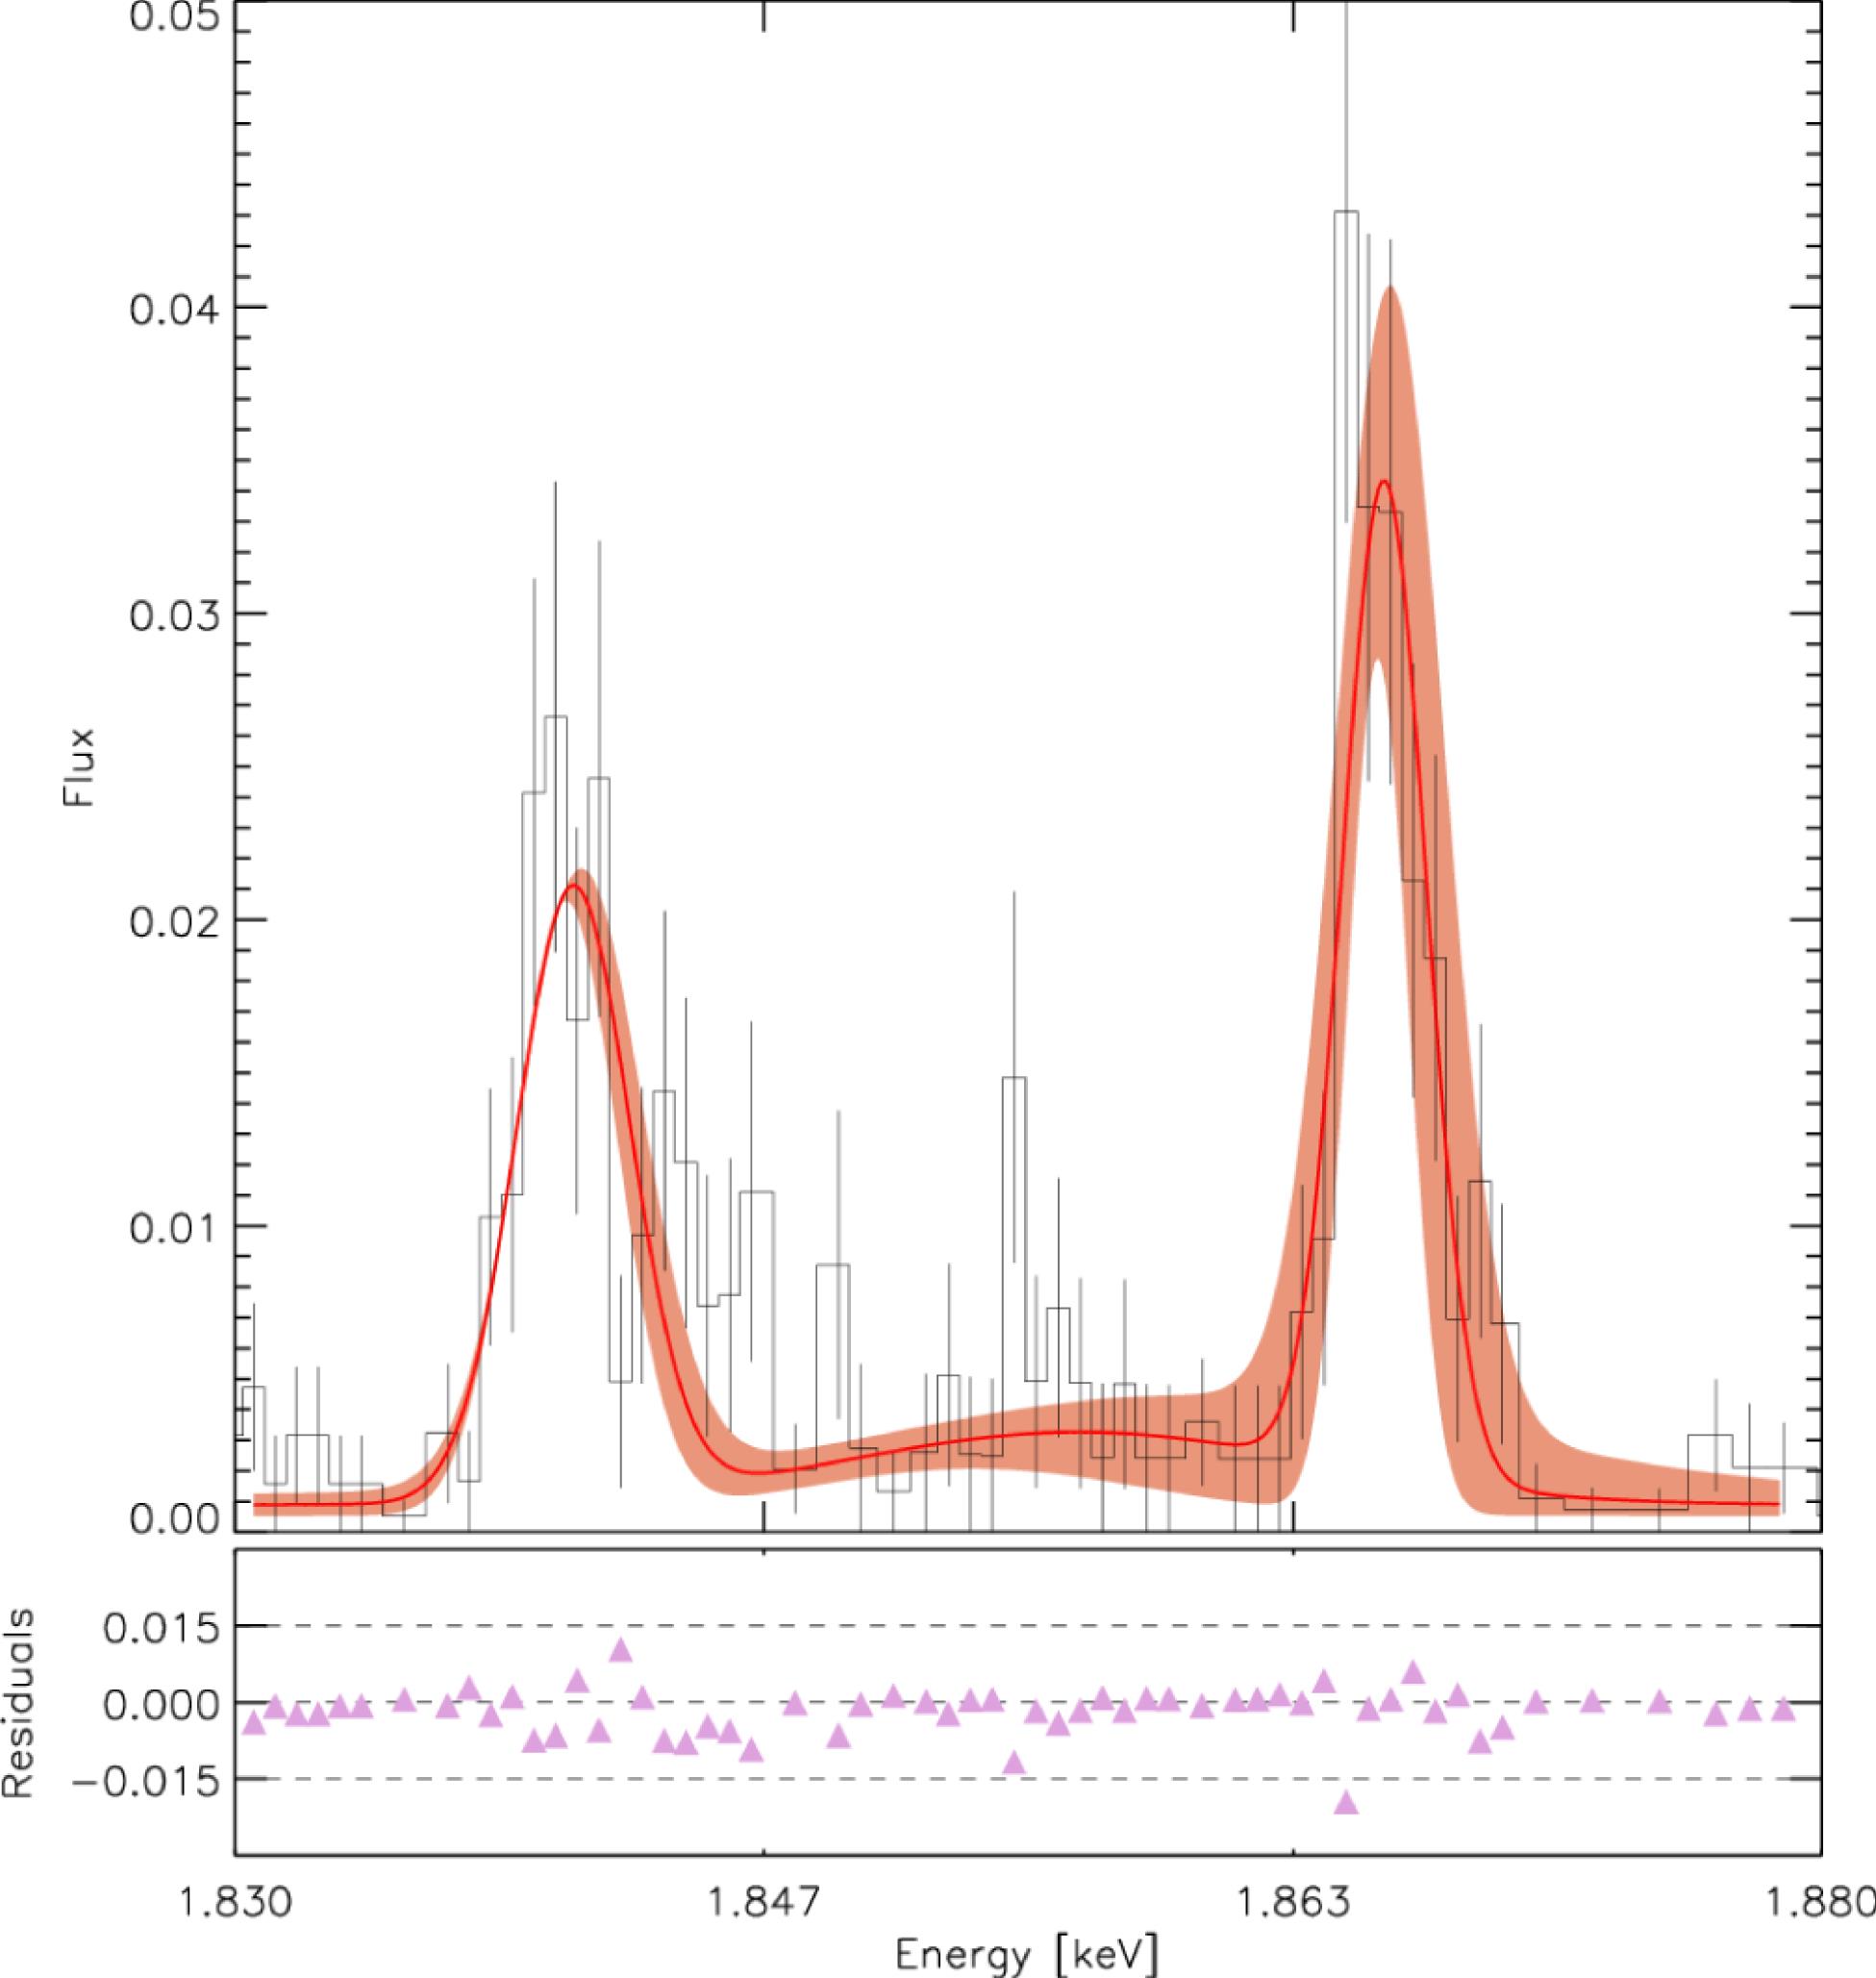
Fig. 1. Reduced  fit for He-triplets with a three-Gaussian model, taking Si
 xiii of Vela X-1 with  as an example. Best fitting result and its error range are shown in red thick line and red shadow, respectively. The observed spectrum and its error bars are shown in black steps.
fit for He-triplets with a three-Gaussian model, taking Si as an example. Best fitting result and its error range are shown in red thick line and red shadow, respectively. The observed spectrum and its error bars are shown in black steps. 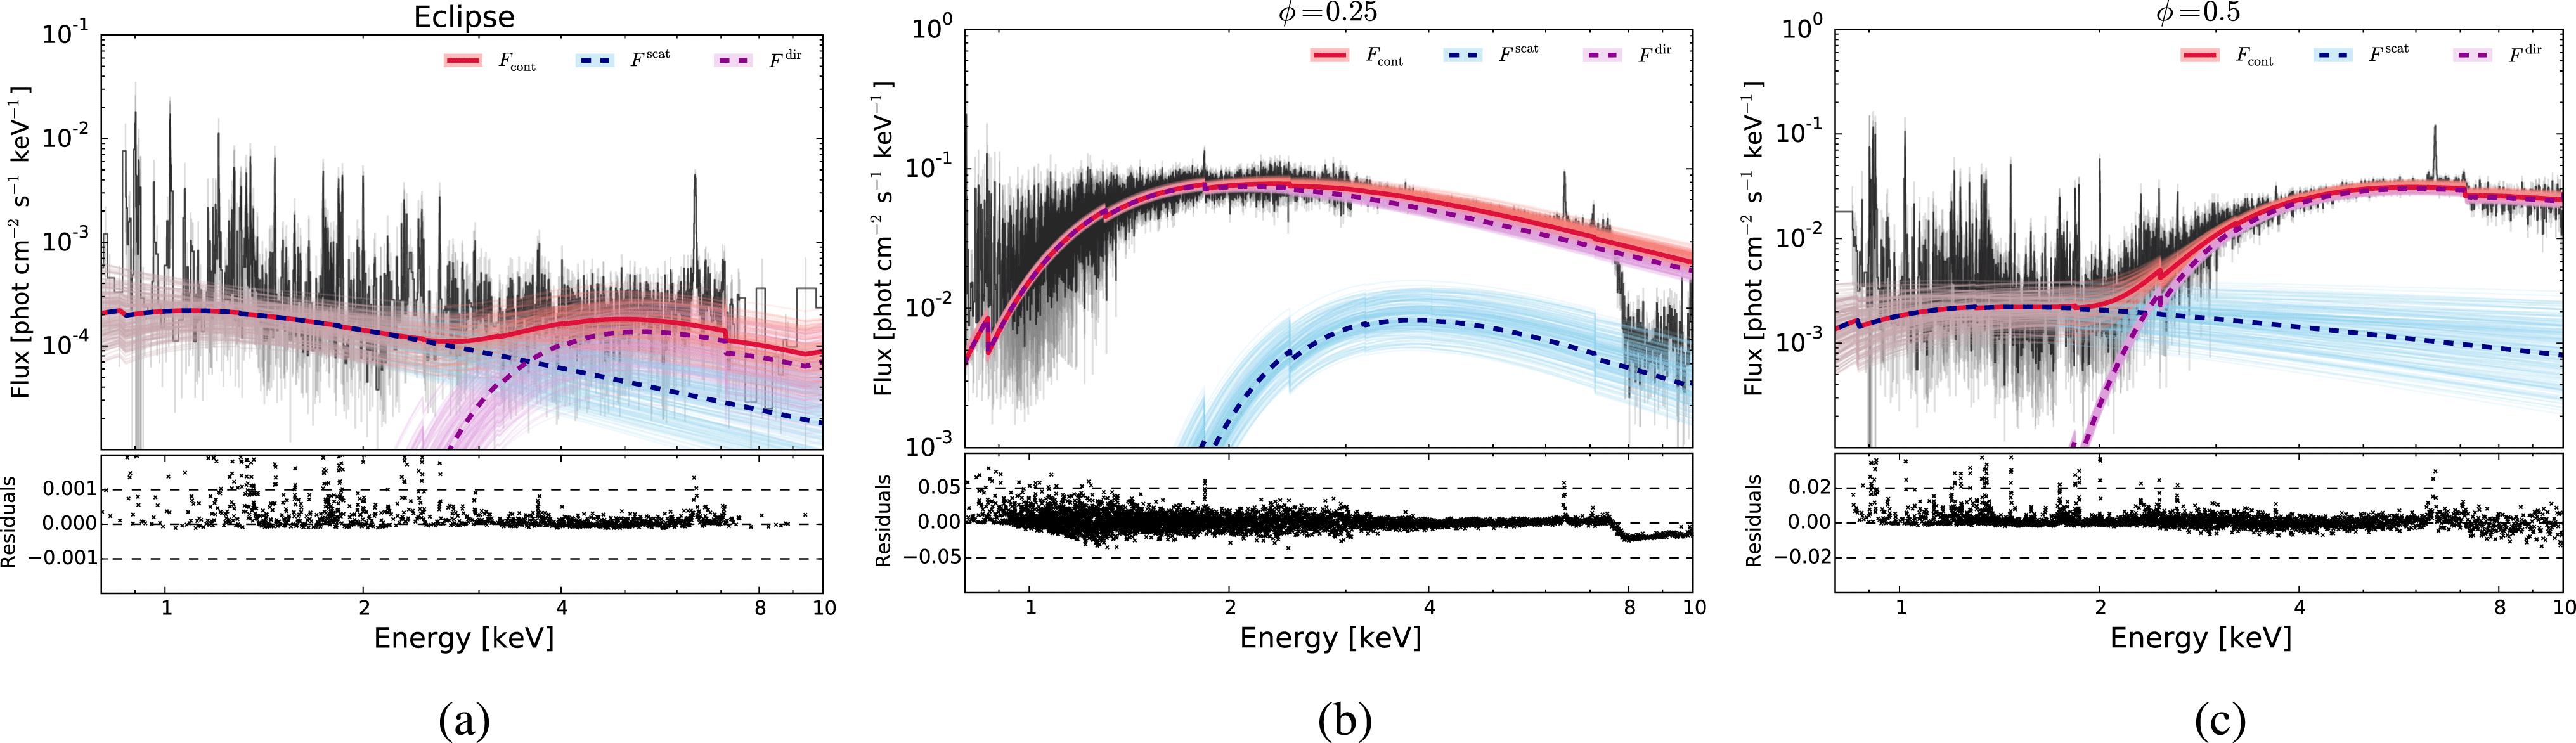
Fig. 2. The best model-predicted continuum shown in red thick lines for three phases. The scatter and direct components are shown separately. Shadows are the 68.3% errors in the recovered value of parameters. The observed spectrum and its error bars are shown in black steps and gray shadow. The large residual values are caused by emission lines.
Fig. 3. The best model-predicted He-like Mg xi shown in red thick line for both (a) the Eclipse phase and (b)  . Red shadows are the 68.3% errors in the recovered value of parameters list in Table
 4 . The observed spectrum and its error bars are shown in black steps.
. Red shadows are the 68.3% errors in the recovered value of parameters list in Table Fig. 4. The best model-predicted He-like Si XIII shown in red thick line for both (a) the Eclipse phase and (b)  . Red shadows are the 68.3% errors in the recovered value of parameters list in Table
 4 . The observed spectrum and its error bars are shown in black steps.
. Red shadows are the 68.3% errors in the recovered value of parameters list in Table Fig. 5. Comparisons with previous works. Red thick lines and their shadows are our present best-fit results. Aqua, blue, and purple dash lines are the results with parameters determined by S99, G04, and W06, respectively.
Fig. 6. Posterior PDFs of parameters and their correlations. Using the parameters of continuum for  as an example. Red lines represent values used in best-fit
  for
for  , and dashed lines correspond to 1-
 error. The plot is made by a Python module
 corner [30].
as an example. Red lines represent values used in best-fit for , and dashed lines correspond to 1- error. The plot is made by a Python module
|
Table 1. A summary of observation information taken from Chandra data archivea .
| ||||||||||||||||||||||||||||||||||||||||||||||||||||||||||||||||||||||||||||||||||||||
Table 2. The range of each parameter which needs to be marginalized in prior functions.
|
Table 3. The best fitted continuum parameters in three different phases.
| ||||||||||||||||||||||||||||||||||||||||||||||||||||||||||||||||||||||||||||||||||||||||||||||||||||||||||||||
Table 4. The best fitted parameters for Mg xi and Si xiii He-like lines in phase of Eclipse.
| ||||||||||||||||||||||||||||||||||||||||||||||||||||||||||||||||||||||||||||||||||||||||||||||||||||||||||||||
Table 5. The best fitted parameters for Mg XI and Si XIII He-like lines for phase of  .
.
.
| |||||||||||||||||||||||||||||
Table 6. The flux comparison with previous studies for  .
.
.
| ||||||||||||||||||||||
Table 7. The comparison with previous studies for  -ratios.
-ratios. 
Set citation alerts for the article
Please enter your email address
© Copyright 2018-2021 | Chinese Laser Press. All Rights Reserved 沪ICP备15018463号-20