
Lan Zhang, Feilu Wang, Xiangxiang Xue, Dawei Yuan, Huigang Wei, Gang Zhao. Physical parameter estimation with MCMC from observations of Vela X-1[J]. High Power Laser Science and Engineering, 2018, 6(2): 02000e37
- High Power Laser Science and Engineering
- Vol. 6, Issue 2, 02000e37 (2018)
Abstract
1 Introduction
High-resolution X-ray spectra from stellar objects are an important tool to infer their plasma structures[
Conventionally, the fitting of X-ray spectra is based on reduced  method (e.g., Sako
  ). As to the spectral lines, the effects of satellite lines have not been considered during the fitting of He-like triplets. For the fitting of both continua and lines, it includes many free parameters, which makes the fitting nonlinear and parameters degenerate. In order to decrease the number of free parameters, some parameters were kept fixed during the fitting process, e.g., G04, based on assumptions and previous understanding. In such cases, pitfalls may exist in the estimate of number of degrees of freedom as well as the corresponding error estimates[
 fit for He-triplets. It can be seen that the model can fit
  and
and  lines (see Section
  if a three-Gaussian model was used to fit the three lines simultaneously. Besides, the error bars resulting from the fit were rather large. If the satellite lines are taken into account, i.e., a five/six-Gaussian model is taken to find satellite lines, this method fails to find any line signals.
In recent years, modern Bayesian inference, a method of statistical inference in which Bayes’ theorem is used to update our knowledge of a physical parameter, was introduced in astrophysical studies to fit complex models and to interpret observations (e.g., Reichart
Sign up for High Power Laser Science and Engineering TOC. Get the latest issue of High Power Laser Science and Engineering delivered right to you!Sign up now
This paper is organized as follows. Section
2 Bayesian inference for X-ray spectrum
In the present paper, we aim to marginalize the posterior PDFs to derive the uncertainties for the parameters of a model fitted to a high-resolution X-ray spectrum. In the Bayesian approach, the posterior PDFs of the model parameters for a given observed spectra,  , is[
, is[
 (1)
(1) is a vector of parameters of a spectral model,
  represents the background noise of an X-ray spectrum and
  is the normalization independent of all the parameters, which means that we could sample
  without computing
  [
[ is the likelihood function of
  given the parameters
  , whose logarithm form can be written as
 (2)
(2) (3)
(3) is parameterized spectral model,
  is the total data number used in spectral fitting, and
  is the error of the observed spectrum.
 is the prior function. Normally, it represents previous knowledge from other experiments and physical limiting conditions, or any other prior beliefs. Here we use a step function over each parameter
 (4)
(4) and
and  is different from case to case.
To approach our propose, we adopt a stable, well-tested MCMC algorithm,  in an
in an  -dimensional space for traditional algorithms. It thus reduces computational costs during the fitting procedure. A complete discussion of the MCMC methods and the algorithms can be found in Ref. [
3 Application to the spectra of Vela X-1
In this section, our method is applied to the spectral study of Vela X-1. Vela X-1 is a well-studied X-ray binary, with extensive astronomical simulations of observations[ Solid-State Image Spectrometer. Other physical properties of Vela X-1 were provided by the high-resolution X-ray spectra during different phases observed with the
  , and
, and  . In addition, W06 probed the stellar wind dynamics and ionization structures by a quantitative analysis of Doppler shift and line intensities with the same X-ray spectra. The previous literature studies are considered to be sufficiently convincing to be used as benchmarks. With the results of these studies, it is possible for us to verify our analysis method.
3.1 Observations
The datasets of Vela X-1 used in our analysis were observed with the  and
and  in 2001, with
| ObsID | Orbital phase | Start date | Exposure [s] |
|---|---|---|---|
| 1926 | Eclipse | 2001-02-11 21:19:13 | 83.15 |
| 1927 | 0.5 | 2001-02-07 09:56:13 | 29.43 |
| 1928 | 0.25 | 2001-02-05 05:28:51 | 29.57 |
Table 1. A summary of observation information taken from
3.2 Model
The spectra of Vela X-1 are considered to be composed of continuum and line emission (W06). Therefore, in the present work, for the likelihood function Equation ( ) and line (
 ), that is,
  , is used to model the spectra of Vela X-1. For
  , we mainly focus on He-like triplets which have relatively high
  -ratio and are commonly used in photoionization plasma diagnostics.
3.2.1 Continuum
As to the continuum emissions of Vela X-1, we adopt a two-component model (S99), having the form
 (5)
(5) is the energy-resolved photon flux (
 ). Equation (
 and
and  , (units:
  ), are normalizations corresponding to the two components.
  is the photoelectric absorption cross-sections taken from Morrison and McCammon[
 and
and  are the photon indices of each component. In previous literature studies, one power-law model was also used (W06), but such a kind of model could barely fit the continuum of
  below 3 keV. In the present work, we are interested in the He-like triplets which gather below 3 keV. Therefore, we take the two-component model to get more accurate and precise continua.
3.2.2 Lines
Each set of He-like triplets is described by a multi-Gaussian model, that is,
 (6)
(6) is the energy-resolved photon flux, which has the same dimensionality as
  , and
, and  is the total number of lines fitted in each set of He-like line emission. As we know, photoionized plasma shows robust satellite lines[
 :
:  –
–  ), the intercombination lines (
 ,
,  :
:  –
–  , respectively) and the forbidden line (
 :
:  –
–  ).
).  ,
,  and
and  represent intensity, central energy and line width of each line, respectively, which are parameters we intend to marginalize simultaneously.
3.3 Parameters and prior functions
In the continuum fittings of S99 for the Eclipse phase, the photon indices of the two components were set equal because they assumed that photon scattering is elastic, so that it does not alter the spectral shape. In G04, the photon index was fixed to 1.7 in both power laws in the Eclipse phase, while in other phases  and
and  was varied. However, the stellar wind is not strictly spherical because of the wake structures including accretion and photoionized wake (see Figure 8 of Ref. [
 of the stellar wind, is a function of orbital phase (from phase 0.1 to 0.9). That means the indices
  and
and  may change in different phases. Thus, in our analysis we set
  and
and  as free parameters in the data-model fitting. In Equation (
 which could be considered as an adjustment for the observation error to take the background into account. Therefore, the predictions for
  are based on seven parameters
  for each phase, where
  .
.
He-like triplets can be detected in the phases of Eclipse and  . Therefore, we only fit He-like triplets for the two phases. Among these emission lines, Mg
  ratio are adopted as the fitting sample in the present work. In our analysis, the main and satellite lines are fitted simultaneously by multi-Gaussian components for each set of He-like emission lines. Here we describe them as follows.
Mg Si
Selecting suitable upper limits for each parameter in prior functions is based on previous studies (e.g., S99, G04, W06) and observations for Vela X-1. Considering the observed flux and previous studies and experiments, the upper limits of each parameter are listed in Table  for the observed flux; thus, the upper limit of
  is set to
  for the Eclipse phase and
  for other phases.
| Range | |||
|---|---|---|---|
| Parameters | Eclipse | ||
 | [0.00, 0.02] | [0.00, 0.20] | [0.00, 0.20] |
(  ) ) | |||
 | [0.00, 10.00] | [0.00, 10.00] | [0.00, 10.00] |
( ) ) | |||
 | [0.00, 3.00] | [0.00, 3.00] | [0.00, 3.00] |
 | [0.00, 0.20] | [0.00, 1.00] | [0.00, 1.00] |
( ) ) | |||
 | [0.00,100.00] | [0.00,100.00] | [0.00,100.00] |
( ) ) | |||
 | [0.00, 3.00] | [0.00, 3.00] | [0.00, 3.00] |
 | [0.00, 0.01] |  | [0.00, 0.10] |
(  ) ) | |||
Mg ,  | [1.325, 1.340] |  | [1.325, 1.340] |
| Mg | [1.330, 1.340] |  | [1.330, 1.340] |
Mg ,  | [1.335, 1.345] |  | [1.335, 1.350] |
| Mg | [1.350, 1.360] |  | [1.345, 1.360] |
Mg ,  | [1.345, 1.360] |  | [1.345, 1.360] |
 (keV) Si , (keV) Si ,  | [1.830, 1.850] |  | [1.835, 1.855] |
| Si | [1.840, 1.850] |  | [1.840, 1.855] |
Si ,  | [1.850, 1.860] |  | [1.850, 1.860] |
Si ,  | [1.850, 1.860] |  | [1.850, 1.860] |
Si ,  | [1.850, 1.875] |  | [1.855, 1.875] |
 (keV) (keV) | [0.00, 2.50] |  | [0.00, 2.50] |
Table 2. The range of each parameter which needs to be marginalized in prior functions.
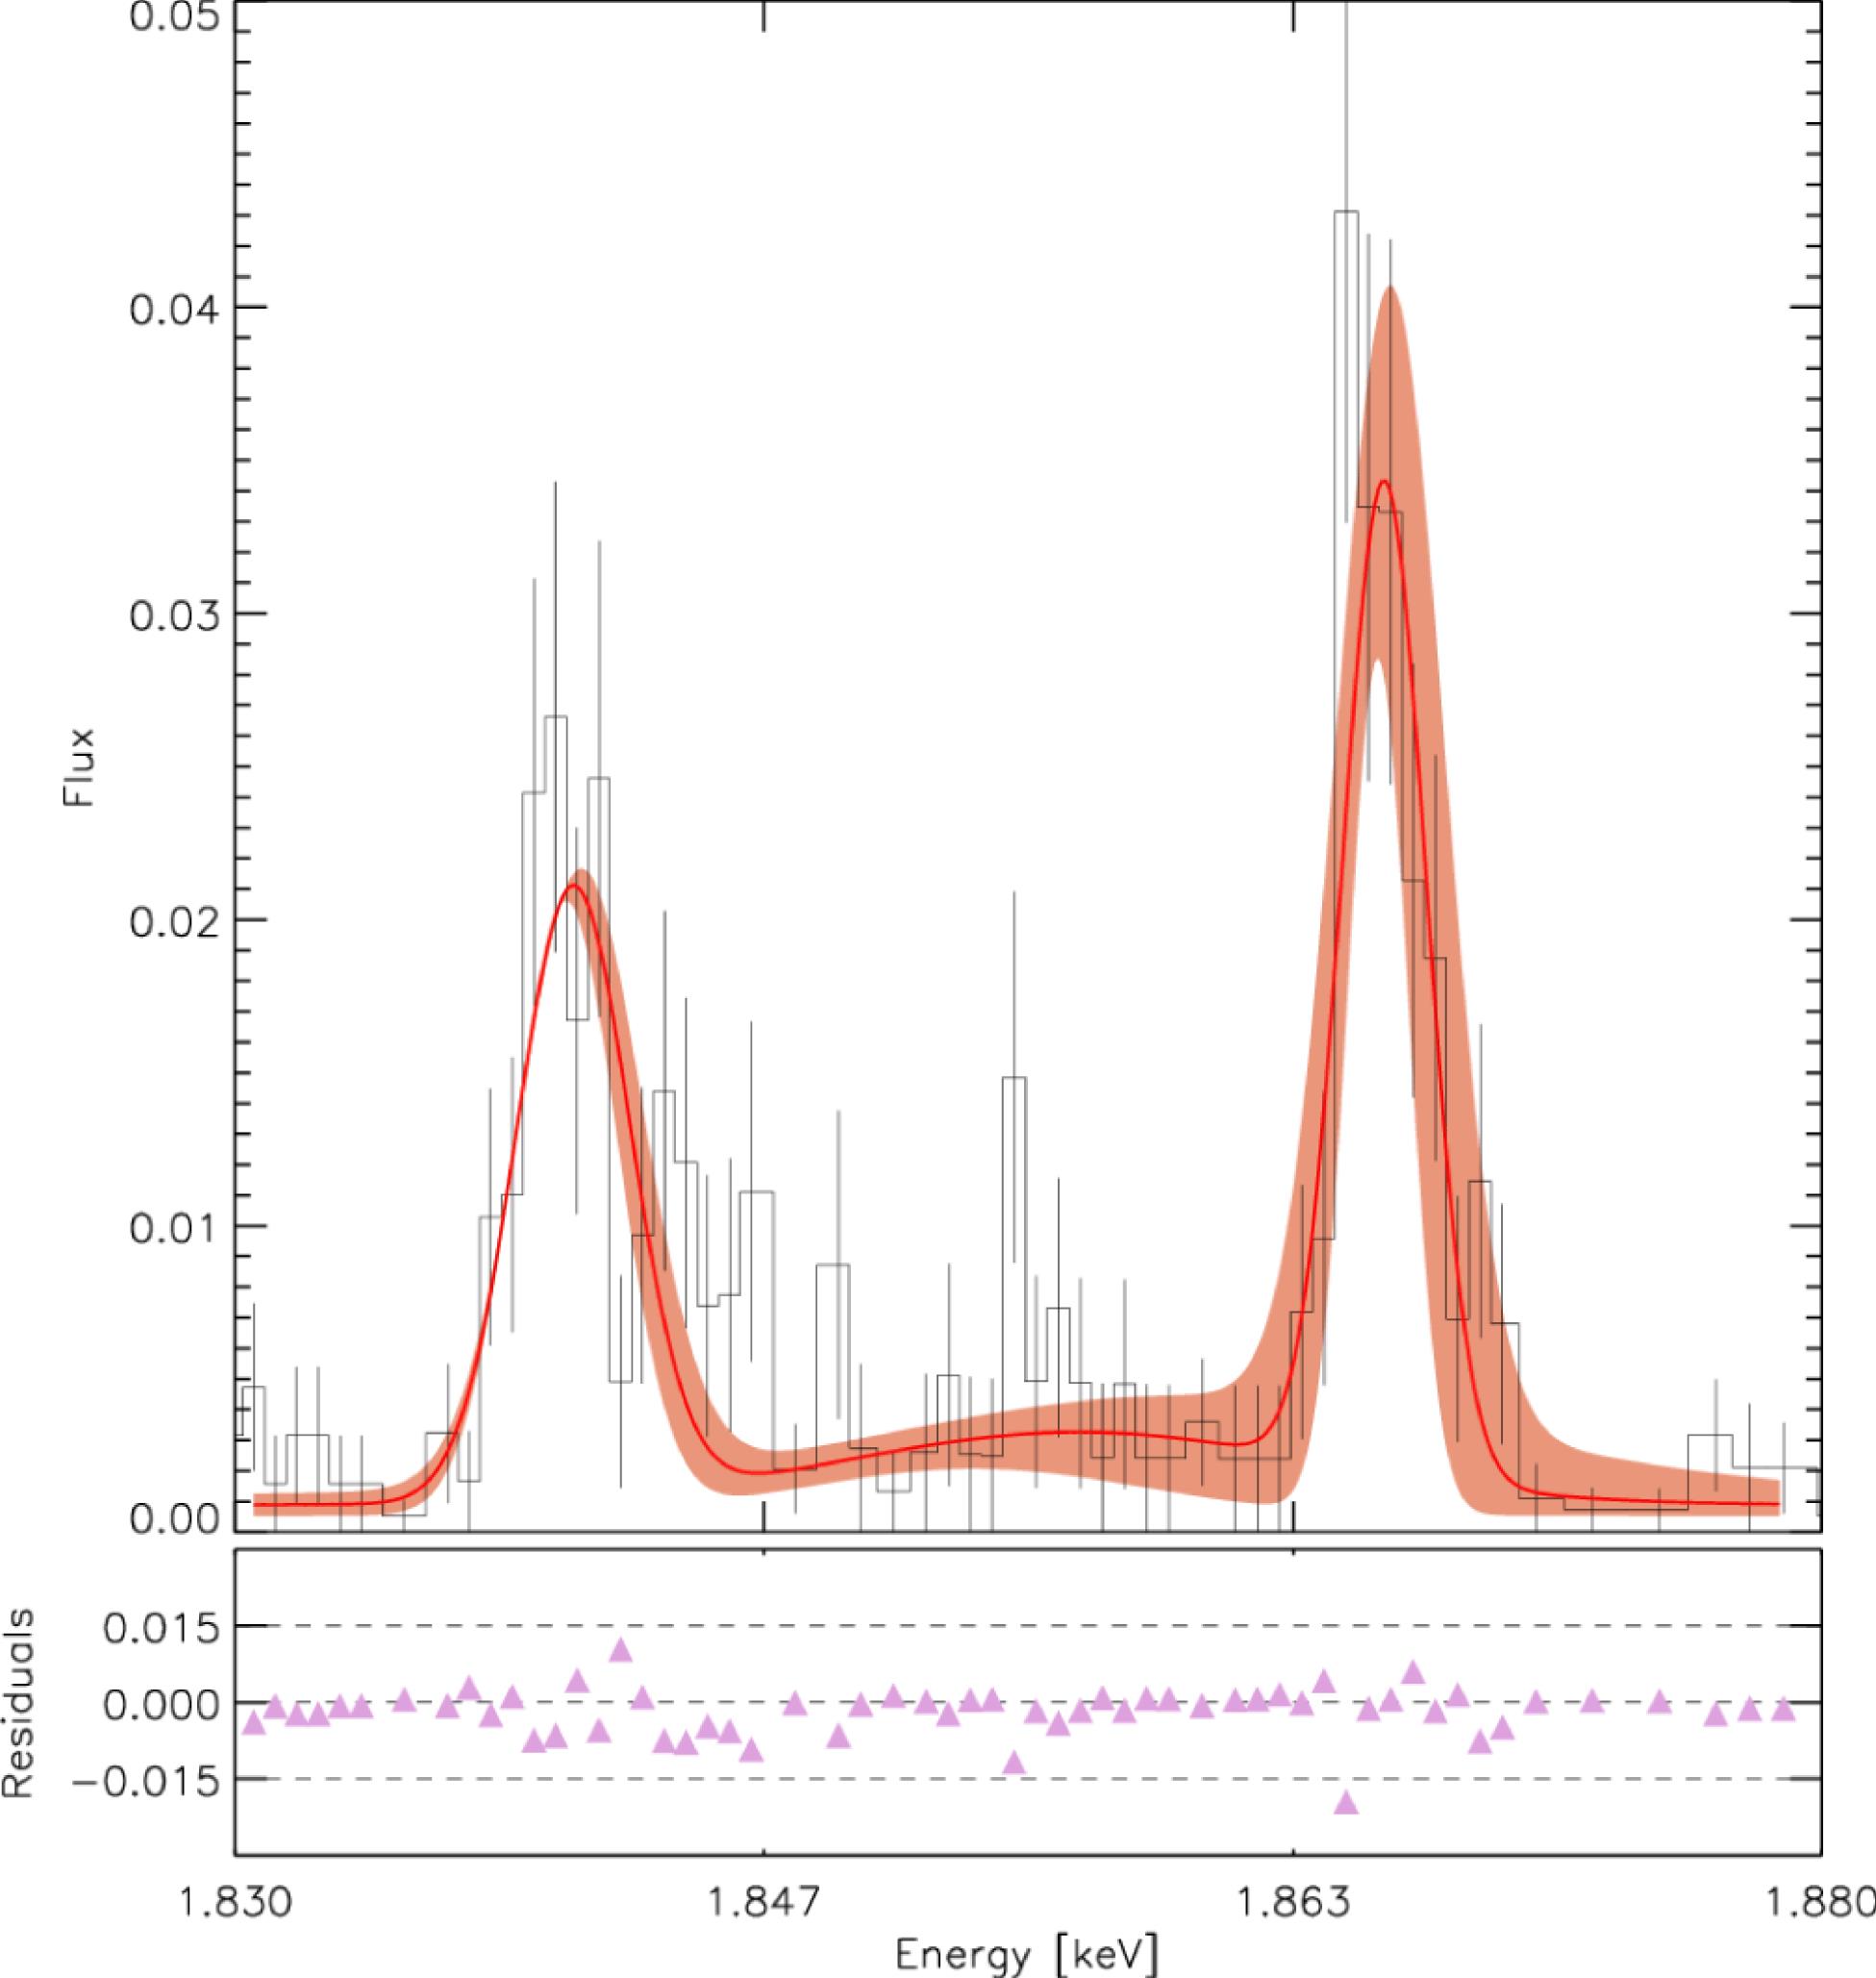
4 Results and discussion
The best-fit parameters and their uncertainties of  and
and  are listed in Tables
  and
and  implied by our fits using the models of Equations (
 and
and  for the most likely parameters, and the band of light red lines shows a
  sampling of the posterior PDFs returned by
  and
and  . For
. For  , the contributions from scatter and direct components are individually shown in blue and purple dashed lines, respectively. Error regions of parameters are directly derived from 68% confidence interval of the posterior PDFs of fitted parameters. It can be seen that the residuals between models and observations scatter around zero, which proves the fits are unbiased.
| Parameters | Eclipse | ||
|---|---|---|---|
 |  |  |  |
(  ) ) | |||
 |  |  |  |
( ) ) | |||
 |  |  |  |
 |  |  |  |
( ) ) | |||
 |  |  |  |
( ) ) | |||
 |  |  |  |
 | 4.67 | 8.13 | 7.43 |
Table 3. The best fitted continuum parameters in three different phases.
| W06 | |||||||
|---|---|---|---|---|---|---|---|
| Intensity | Flux | Flux | |||||
| Energy | ( | ( | Velocity | ( | Velocity | ||
| Elements | (keV) | (eV) | ( | ( | |||
Mg ,  |  |  |  |  |  |  |  |
| Mg |  |  |  |  |  |  |  |
Mg ,  |  |  |  |  |  |  |  |
| Mg |  |  |  |  |  |  |  |
Mg ,  |  |  |  |  |  |  |  |
Si ,  |  |  |  |  |  |  |  |
| Si |  |  |  |  |  |  |  |
Si ,  |  |  |  |  |  |  |  |
Si ,  |  |  |  |  |  | ||
Si ,  |  |  |  |  |  |  |  |
Table 4. The best fitted parameters for Mg
| W06 | |||||||
|---|---|---|---|---|---|---|---|
| Intensity | Flux | Flux | |||||
| Energy | ( | ( | Velocity | ( | Velocity | ||
| Elements | (keV) | (eV) | ( | ( | |||
Mg ,  |  |  |  |  |  |  |  |
| Mg |  |  |  |  |  |  |  |
Mg ,  |  |  |  |  |  |  |  |
| Mg |  |  |  |  |  |  |  |
Mg ,  |  |  |  |  |  |  |  |
Si ,  |  |  |  |  |  |  |  |
| Si |  |  |  |  |  |  |  |
Si ,  |  |  |  |  |  |  |  |
Si ,  |  |  |  |  |  | ||
Si ,  |  |  |  |  |  |  |  |
Table 5. The best fitted parameters for Mg XI and Si XIII He-like lines for phase of  .
.
4.1 Comparison with previous studies
The results of previous studies are listed in Table
4.1.1 
Our best-fit continua are systematically lower ( ) than those of G04 probably due to exclusion of emission lines in our fitting and 28% larger than the ones of W06. For the Eclipse phase, our derived flux is 8% higher than that of S02, but 132% lower than the one of S99. Figure
  with the parameters from literatures into context.
Considering the confidence ranges of our fitting, our  results are in good agreements with previous literature studies (i.e., S99, G04, and W06). For Eclipse, both the results of S99 and G04 fall in our
  fitting error range in which observed uncertainties are concluded, but our result is systematically lower and the shapes of the continua are different especially in the energy range of 2–4 keV where some He-like triplets such as Si and Mg occur. Our lower results are mainly caused by excluding emission lines during the continuum fitting process. The shape of continuum is determined by photon indices
  and
and  which are both set as free parameters in the present study. In S99, both of
  and
and  were fixed to 1.7, and G04 set
  as free for convenient reason. This is a main cause for such a difference. We adopt Bayesian inference to probe all possible values of photon indices, which help us well in understanding the shape of continua and even the structure of the stellar wind of the HMBX system. For
  and
and  , in the energy range of 3–10 keV the continua are in very good agreements with those of G04 and W06. But in the range below 3 keV the results are much higher than that in W06. It may be because they used a one-power-law model in their studies. Similarly, excluding emission lines is the main reason why the result of G04 is larger than ours in lower energy range for
  . The fitted continuum of G04 in
  is lower than lower limit given by our analysis, and it may be caused by fixing the photon-index value during the fitting process. As we discuss in Section
  , all modeled continua cannot fit the observed ones in the range of 8–10 keV. From Figure
  . However, the models predict a larger contribution from
  . That is why there is a gap between models and observation in the 8–10 keV range for
  . Fortunately, as there are no emission lines detected there, the gap would not affect our final results.
 for the three phases are all equal to
  in G04 which implies a spherical stellar wind. In our present fitting,
  varies from phase to phase, e.g.,
  ,
,  and
and  for Eclipse,
  and
and  , respectively. It implies a non-spherical structure of the stellar wind, which agrees with the simulation in Ref. [
| Flux | |||
|---|---|---|---|
| Eclipse | |||
| Z17 |  |  |  |
| S99 |  |  |  |
| S02 |  |  |  |
| G04 |  |  |  |
| W06 |  |  |  |
Table 6. The flux comparison with previous studies for  .
.
4.1.2 
As shown in Tables  cm
cm which corresponds to the density of
  and the distance of 1.9 kpc. The flux values listed in W06 were compensated by absorption values, which shower higher values. (2) The contributions of satellite lines are subtracted during our flux calculation. Although there is a systematic difference in absolute line flux between the calculations of W06 and ours, after calculating the
  -ratio[
 (7)
(7) -ratio still have good agreements with the ones of W06 in 90% confidence region, which proves the validity of the present method. With the X-ray photoionized plasma diagnostics[
 -ratios of W06 and ours derive the same plasma temperature.
Also shown in Tables  ,
,  and
and  lines of each set of He-like triplets show consistent velocity results in
  error region, compared with the calculations in W06. The main reason is the inclusion of the satellites during our fitting process. Using Si
  line. In this situation, the derived velocity would be reduced in the Eclipse phase and increased in
  if satellite lines were not separated from main He-like triplets during the fitting.
| Z17 | W06 | ||
|---|---|---|---|
| Eclipse | Mg |  |  |
| Si |  |  | |
 | Mg |  |  |
| Si |  |  | |
Table 7. The comparison with previous studies for  -ratios.
4.2 Backgrounds and posterior PDFs
Next we estimate the background effects. As we stated before, we did not subtract the background because their source is not well understood. Any inaccuracy in their subtraction would seriously affect the line intensity determination. We treat it as a correction for the observation error.
Its effect, thereby, results in relatively larger uncertainties of parameters compared with previous literature results. From the posterior PDFs (Figure  , using the case of
  as an example, it is possible for us to estimate the average contributions of the backgrounds. The value is
  for the
  and
and  for the
  , which are larger than the estimates of 3% in W06. The value for the Eclipse phase is
  . It is in agreement with the maximum of 5% in W06, in which they derive this value from the adjacent region to the dispersed event region of the observed spectrum.
From Figure  and
and  are degenerate. Setting
  to be same for all the phases results in the same values of
  for all the phases, which consequently implies a spherical stellar wind. In the present work, we set all parameters free and find the most likely values in parameter space. The fitted
  varies from phase to phase due to setting
  as free. For the photoionized plasma in other astronomical objects, non-fixing any parameters would provide a general approach to deal with their X-ray observed spectra.
5 Summary
In this paper, we introduce the Bayesian approach, which is applied to the archive spectra of Vela X-1 with three different phases: Eclipse,  and
and  . We adopt a parameterized two-component power-law model of
  and a multi-Gaussian model of
  to predict the continua and He-like triplets, respectively, for all three phases, by setting all parameters as free. Then we fit the observed continua and He-like triplets of Mg
  ,
,  and the background. Then we derive best-fit parameters and associated uncertainties for which propagation from the observational errors, uncertainty in the background and the errors from fitting process are all considered. In our results, the column density of scatter component
  varies from phase to phase, which implies a non-spherical structure of stellar wind. Moreover, our measured wind velocities show very good self-consistency, which provides a reliable approach for the diagnostics of photoionized plasma in the future.
References
[2] D. Porquet, J. Dubau. Astron. Astrophys., 143, 495(2000).
[3] D. Porquet, J. Dubau, N. Grosso. Space Sci. Rev., 157, 103(2010).
[5] J. M. Blondin, T. R. Kallman, B. A. Fryxell, R. E. Taam. Astrophys. J., 356, 591(1990).
[6] M. Sako, D. A. Liedahl, S. M. Kahn, F. Paerels. Astrophys. J., 525, 921(1999).
[7] G. Goldstein, D. P. Huenemoerder, D. Blank. Astronomical J., 127, 2310(2004).
[9] R. Andrae, T. Schulze-Hartung, P. Melchior.
[10] D. E. Reichart, F. J. Castander, R. C. Nichol. Astrophys. J., 516, 1(1999).
[11] N. Benítez. Astrophys. J., 536, 571(2000).
[13] M. G. Walker, E. W. Olszewski, M. Mateo. Mon. Not. R. Astron. Soc., 448, 2717(2015).
[14] D. Foreman-Mackey, D. W. Hogg, D. Lang, J. Goodman. Publ. Astron. Soc. Pacific, 125, 306(2013).
[15] D. J. MacKay. Information Theory, Inference and Learning Algorithms(2003).
[16] W. H. Press. Numerical Recipes: The Art of Scientific Computing(2007).
[17] J. Goodman, J. Weare. Commun. Appl. Math. Comput. Sci., 5, 65(2010).
[19] H.-K. Chung, M. Chen, W. Morgan, Y. Ralchenko, R. Lee. High Energy Density Phys., 1, 3(2005).
[20] B. Han, F. Wang, D. Salzmann, G. Zhao. Publ. Astron. Soc. Jpn., 67, 29(2015).
[21] M. P. Ulmer, W. A. Baity, W. A. Wheaton, L. E. Peterson. Astrophys. J. Lett., 178, L121(1972).
[22] M. Sako, S. M. Kahn, F. Paerels, D. A. Liedahl, S. Watanabe, F. Nagase, T. Takahashi.
[23] N. S. Schulz, C. R. Canizares, J. C. Lee, M. Sako. Astrophys. J. Lett., 564, L21(2002).
[24] B. Paul, G. C. Dewangan, M. Sako, S. M. Kahn, F. Paerels, D. Liedahl, P. Wojdowski, F. Nagase, S. Ikeuchi, J. Hearnshaw, T. Hanawa. 8th Asian-Pacific Regional Meeting, Volume II, 355(2002).
[25] R. Morrison, D. McCammon. Astrophys. J., 270, 119(1983).
[26] D. A. Liedahl, F. Paerels. Astrophys. J. Lett., 468, L33(1996).
[27] L. Kaper, G. Hammerschlag-Hensberge, E. J. Zuiderwijk. Astron. Astrophys., 289, 846(1994).
[28] J. M. Blondin, I. R. Stevens, T. R. Kallman. Astrophys. J., 371, 684(1991).
[29] F. Wang, B. Han, D. Salzmann, G. Zhao. Phys. Plasmas, 24(2017).
[30] D. Foreman-Mackey. J. Open Source Software, 1, 24(2016).

Set citation alerts for the article
Please enter your email address
© Copyright 2018-2021 | Chinese Laser Press. All Rights Reserved 沪ICP备15018463号-20