
Jingwei Zhang, Zhongfeng Qiu. Evaluation of Data Quality of FY-3D Satellite Sensor MERSI II over Marine Waters[J]. Acta Optica Sinica, 2021, 41(12): 1201002
- Acta Optica Sinica
- Vol. 41, Issue 12, 1201002 (2021)
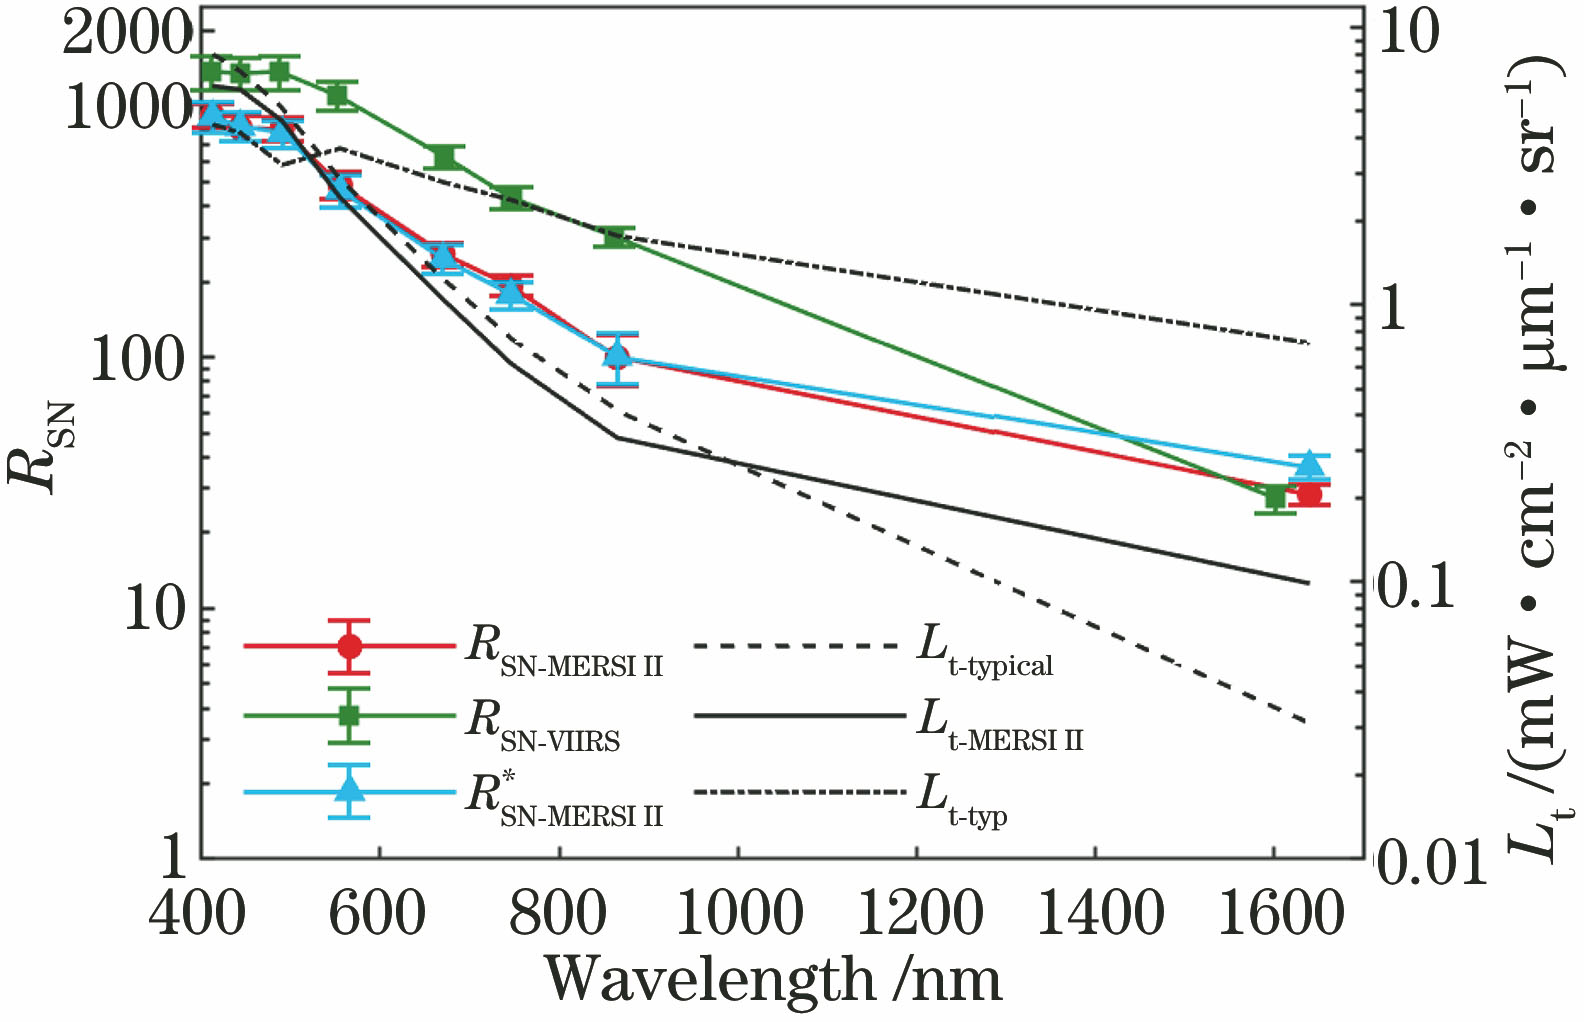
Fig. 1. Signal-to-noise ratio results of MERSI II and VIIRS
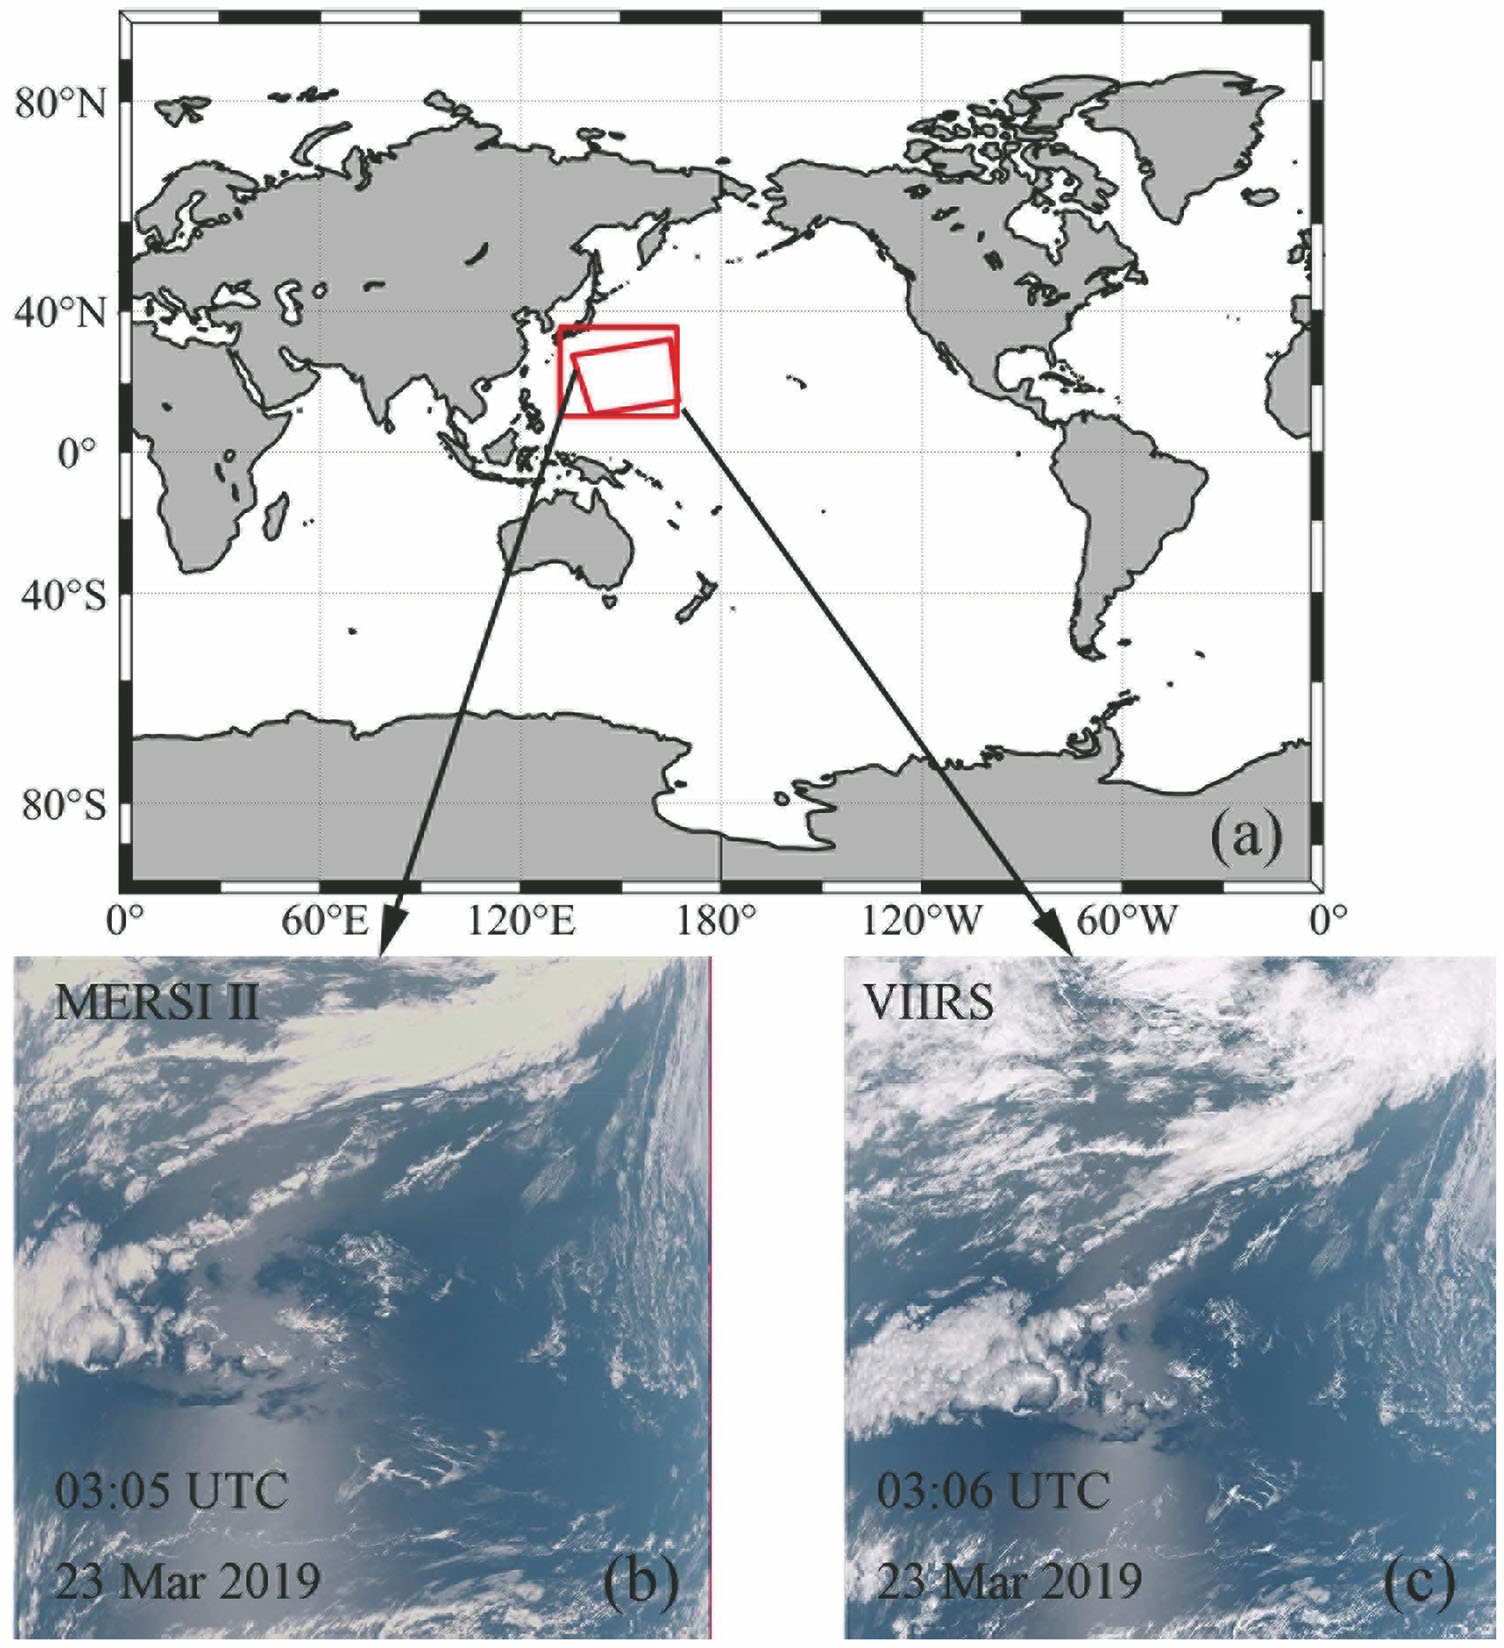
Fig. 2. True-color red-green-blue composite image from MERSI II and VIIRS on March 23, 2019. (a) Image coverage; (b) MERSI II RGB composite image; (c) VIIRS RGB composite image
Fig. 3. Scatter density diagrams from MERSI II and VIIRS ρt data on March 23, 2019. (a) At 412 nm waveband; (b) at 443 nm waveband; (c) at 490 nm waveband; (d) at 555 nm waveband; (e) at 670 nm waveband; (f) at 746 nm waveband; (g) at 865 nm waveband
Fig. 4. Scatter density diagrams from MERSI II linear fitted ρt data and VIIRS ρt data on March 23, 2019. (a) At 412 nm waveband; (b) at 443 nm waveband; (c) at 490 nm waveband; (d) at 555 nm waveband; (e) at 670 nm waveband; (f) at 746 nm waveband; (g) at 865 nm waveband
Fig. 5. Variation of fitting coefficient with 12 scenes remote sensing images on March 23, 2019. (a) At 412 nm waveband; (b) at 443 nm waveband; (c) at 490 nm waveband; (d) at 555 nm waveband; (e) at 670 nm waveband; (f) at 746 nm waveband; (g) at 865 nm waveband
Fig. 6. EMAPE changes between MERSI II ρt data before and after linear fitting and VIIRS ρt data at different remote sensing images on March 23, 2019. (a) 1st matching scene; (b) 2nd matching scene; (c) 3rd matching scene; (d) 4th matching scene; (e) 5th matching scene; (f) 6th matching scene; (g) 7th matching scene; (h) 8th matching scene; (i) 9th matching scene; (j) 10th matching scene; (k) 11th matching scene; (l) 12th matching scene
Fig. 7. Scatter density diagrams from MERSI II and VIIRS ρt data on May 29, 2019. (a) At 412 nm waveband; (b) at 443 nm waveband; (c) at 490 nm waveband; (d) at 555 nm waveband; (e) at 670 nm waveband; (f) at 746 nm waveband; (g) at 865 nm waveband
Fig. 8. Scatter density diagrams from MERSI II linear fitted ρt data and VIIRS ρt data on May 29, 2019. (a) At 412 nm waveband; (b) at 443 nm waveband; (c) at 490 nm waveband; (d) at 555 nm waveband; (e) at 670 nm waveband; (f) at 746 nm waveband; (g) at 865 nm waveband
Fig. 9. EMAPE changes between MERSI II ρt data before and after linear fitting and VIIRS ρt data at different remote sensing images on May 29, 2019. (a) 1st matching scene; (b) 2nd matching scene; (c) 3rd matching scene; (d) 4th matching scene; (e) 5th matching scene; (f) 6th matching scene; (g) 7th matching scene; (h) 8th matching scene; (i) 9th matching scene; (j) 10th matching scene; (k) 11th matching scene; (l) 12th matching scene
Fig. 10. LandSeaMask distribution in China coastal water
Fig. 11. Scatter density diagrams in Region1 from MERSI II and VIIRS ρt data on May 29, 2019. (a) At 412 nm waveband; (b) at 443 nm waveband; (c) at 490 nm waveband; (d) at 555 nm waveband; (e) at 670 nm waveband; (f) at 746 nm waveband; (g) at 865 nm waveband
Fig. 12. Scatter density diagrams in Region1 from MERSI II linear fitted ρt data and VIIRS ρt data on May 29, 2019. (a) At 412 nm waveband; (b) at 443 nm waveband; (c) at 490 nm waveband; (d) at 555 nm waveband; (e) at 670 nm waveband; (f) at 746 nm waveband; (g) at 865 nm waveband
Fig. 13. Scatter density diagrams in Region2 from MERSI II and VIIRS ρt data on May 29, 2019. (a) At 412 nm waveband; (b) at 443 nm waveband; (c) at 490 nm waveband; (d) at 555 nm waveband; (e) at 670 nm waveband; (f) at 746 nm waveband; (g) at 865 nm waveband
Fig. 14. Scatter density diagrams in Region2 from MERSI II linear fitted ρt data and VIIRS ρt data on May 29, 2019. (a) At 412 nm waveband; (b) at 443 nm waveband; (c) at 490 nm waveband; (d) at 555 nm waveband; (e) at 670 nm waveband; (f) at 746 nm waveband; (g) at 865 nm waveband
Fig. 15. Scatter density diagrams in Region3 from MERSI II and VIIRS ρt data on March 22, 2019. (a) At 412 nm waveband; (b) at 443 nm waveband; (c) at 490 nm waveband; (d) at 555 nm waveband; (e) at 670 nm waveband; (f) at 746 nm waveband; (g) at 865 nm waveband
Fig. 16. Scatter density diagrams in Region3 from MERSI II linear fitted ρt data and VIIRS ρt data on March 22, 2019. (a) At 412 nm waveband; (b) at 443 nm waveband; (c) at 490 nm waveband; (d) at 555 nm waveband; (e) at 670 nm waveband; (f) at 746 nm waveband; (g) at 865 nm waveband
Fig. 17. Scatter density diagrams from MERSI II and VIIRS ρt data after masking sun glint. (a) At 412 nm waveband; (b) at 443 nm waveband; (c) at 490 nm waveband; (d) at 555 nm waveband; (e) at 670 nm waveband; (f) at 746 nm waveband; (g) at 865 nm waveband
Fig. 18. Difference between the solar azimuth angle and the solar zenith angle of MERSI II and VIIRS varies with 12 remote sensing images
Fig. 19. Difference between the sensor azimuth angle and the sensor zenith angle of MERSI II and VIIRS varies with 12 remote sensing images
|
Table 1. Band setting information of MERSI II in solar reflection band
|
Table 2. Band setting information of VIIRS
| ||||||||||||||||||||||||||||||||||||||||||||||||||||||||||||||||||||||||||||||||||
Table 3. Quasi-real-time matching image information of MERSI II and VIIRS in the Western Pacific and China coastal water
| ||||||||||||||||||||||||||||||||||||||||||||||||||||||||||||||||||||||||||||||||||||||||||||||||||||||||||||||
Table 4. Signal-to-noise ratio results of MERSI II and VIIRS


Set citation alerts for the article
Please enter your email address

© Copyright 2018-2021 | Chinese Laser Press. All Rights Reserved 沪ICP备15018463号-20