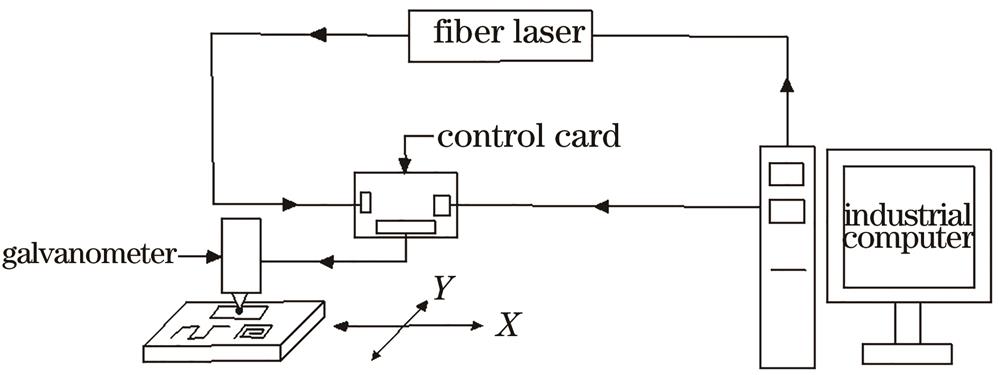
Fig. 1. Schematic of laser polishing equipment
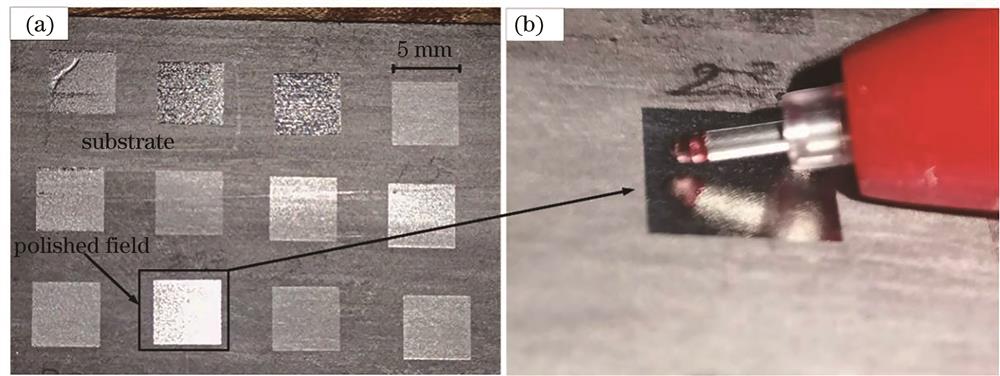
Fig. 2. TC4 alloy after laser polishing. (a) Substrate surface and polished field; (b) surface after laser polishing
Fig. 3. Schematic of laser polishing. (a) Trajectory of laser polishing; (b) mechanism diagram of laser polishing
Fig. 4. Schematic of factors influencing laser polishing
Fig. 5. Surface microscopic morphologies. (a) Original surface; (b) No. 7 -1 sample; (c) No. 9-1 sample; (d) No. 3-1 sample
Fig. 6. Roughness changes before and after laser polishing
Fig. 7. Range effect diagrams.(a) Range variation diagram of defocusing distance; (b) range variation diagram of laser power; (c) range variation diagram of repetition frequency; (d) range variation diagram of scanning speed
Fig. 8. 3D surface topographies of laser polishing. (a) Original surface; (b) surface after polishing with optimal parameters; (c) XY surface without polishing; (d) XY surface after polishing with optimal parameters
Fig. 9. Surface microscopic morphologies. (a) No. 20 sample; (b) No. 9 sample
Fig. 10. Comparison between actual and predicted values
Fig. 11. Effects of significant interaction terms on surface roughness. (a) Effects of laser power and repetition frequency; (b) effects of laser power and scanning speed; (c) effects of repetition frequency and scanning speed
Composition | Al | V | Fe | C | O | N | H | Ti |
---|
Mass fraction /% | 5.50‒6.50 | 3.50‒4.50 | 0‒0.25 | 0‒0.08 | 0‒0.13 | 0‒0.13 | 0‒0.12 | Bal. |
|
Table 1. Main chemical compositions of TC4 titanium alloy
Variable | Low | Medium | High |
---|
Defocusing distance /mm | 3 | 4 | 5 | Laser power /W | 20 | 25 | 30 | Laser repetition frequency /kHz | 70 | 90 | 110 | Laser scanning speed /(mm) | 1650 | 1700 | 1750 |
|
Table 2. Level table of orthogonal experimental factors
Sample No. | h /mm | P /W | f /kHz | v /(mm) | Roughness /μm | Average roughness /μm |
---|
First | Second |
---|
1-1 | 3 | 20 | 70 | 1650 | 0.1868 | 0.1774 | 0.1821 | 2-1 | 3 | 25 | 90 | 1700 | 0.1526 | 0.1640 | 0.1583 | 3-1 | 3 | 30 | 110 | 1750 | 0.1148 | 0.1369 | 0.1259 | 4-1 | 4 | 20 | 90 | 1750 | 0.2291 | 0.2187 | 0.2239 | 5-1 | 4 | 25 | 110 | 1650 | 0.2329 | 0.2481 | 0.2405 | 6-1 | 4 | 30 | 70 | 1700 | 0.1931 | 0.1783 | 0.1857 | 7-1 | 5 | 20 | 110 | 1700 | 0.2775 | 0.2893 | 0.2834 | 8-1 | 5 | 25 | 70 | 1750 | 0.1988 | 0.2376 | 0.2182 | 9-1 | 5 | 30 | 90 | 1650 | 0.2022 | 0.1952 | 0.1987 |
|
Table 3. Design matrix of orthogonal experiment and results
Parameter | h /mm | P /W | f /kHz | v /(mm⋅) |
---|
| 0.1554 | 0.2298 | 0.1953 | 0.2071 | | 0.2167 | 0.2057 | 0.1936 | 0.2091 | | 0.2334 | 0.1701 | 0.2166 | 0.1893 | R | 0.078 | 0.0597 | 0.023 | 0.0198 |
|
Table 4. Range analysis results
Sample No. | h /mm | P /W | f /kHz | /(mm) | /μm |
---|
1 | 5 | 25 | 90 | 1750 | 0.2340 | 2 | 4 | 25 | 90 | 1700 | 0.1842 | 3 | 4 | 25 | 90 | 1700 | 0.1968 | 4 | 4 | 20 | 90 | 1650 | 0.1790 | 5 | 5 | 25 | 90 | 1650 | 0.2301 | 6 | 5 | 25 | 110 | 1700 | 0.2565 | 7 | 4 | 20 | 110 | 1700 | 0.2611 | 8 | 5 | 30 | 90 | 1700 | 0.2098 | 9 | 3 | 30 | 90 | 1700 | 0.1115 | 10 | 4 | 25 | 70 | 1650 | 0.1688 | 11 | 4 | 20 | 90 | 1750 | 0.2340 | 12 | 4 | 30 | 90 | 1750 | 0.1546 | 13 | 3 | 25 | 110 | 1700 | 0.1799 | 14 | 4 | 25 | 110 | 1650 | 0.2440 | 15 | 4 | 30 | 70 | 1700 | 0.1818 | 16 | 4 | 30 | 110 | 1700 | 0.1878 | 17 | 4 | 30 | 90 | 1650 | 0.1784 | 18 | 3 | 25 | 90 | 1750 | 0.1756 | 19 | 4 | 20 | 70 | 1700 | 0.2012 | 20 | 5 | 20 | 90 | 1700 | 0.2732 | 21 | 3 | 25 | 70 | 1700 | 0.1381 | 22 | 4 | 25 | 90 | 1700 | 0.1932 | 23 | 4 | 25 | 90 | 1700 | 0.2009 | 24 | 4 | 25 | 70 | 1750 | 0.1982 | 25 | 5 | 25 | 70 | 1700 | 0.2298 | 26 | 4 | 25 | 110 | 1750 | 0.2189 | 27 | 3 | 25 | 90 | 1650 | 0.1422 | 28 | 3 | 20 | 90 | 1700 | 0.1820 | 29 | 4 | 25 | 90 | 1700 | 0.1955 |
|
Table 5. BBD experimental parameters and results
Source | Sum of squares | Mean square | | | Reliability |
---|
R2=0.9576 | =0.9406 | =0.9002 | | | Model | 0.038 | 0.004758 | 56.4 | < 0.0001 | Significant | A | 0.021 | 0.021 | 251.14 | < 0.0001 | | B | 0.007831 | 0.007831 | 92.83 | < 0.0001 | | C | 0.004419 | 0.004419 | 52.39 | < 0.0001 | | D | 0.00044 | 0.00044 | 5.22 | 0.0335 | | BC | 0.000725 | 0.000725 | 8.59 | 0.0083 | | BD | 0.001551 | 0.001551 | 18.38 | 0.0004 | | CD | 0.0007437 | 0.0007437 | 8.82 | 0.0076 | | C2 | 0.001167 | 0.001167 | 13.83 | 0.0014 | | Residual | 0.001687 | 0.00008436 | | | | Lack of fit value | 0.001532 | 0.00009578 | 2.48 | 0.1969 | Not significant | Pure error | 0.0001547 | 0.00003868 | | | | Total | 0.04 | | | | |
|
Table 6. Variance analysis of surface roughness model