
Hong Tian, Xuegong Hu, Jihui Wang. Heat Transfer Performance of LED Radiator with Triangular Groove Extended Surface[J]. Acta Optica Sinica, 2018, 38(12): 1223002
- Acta Optica Sinica
- Vol. 38, Issue 12, 1223002 (2018)
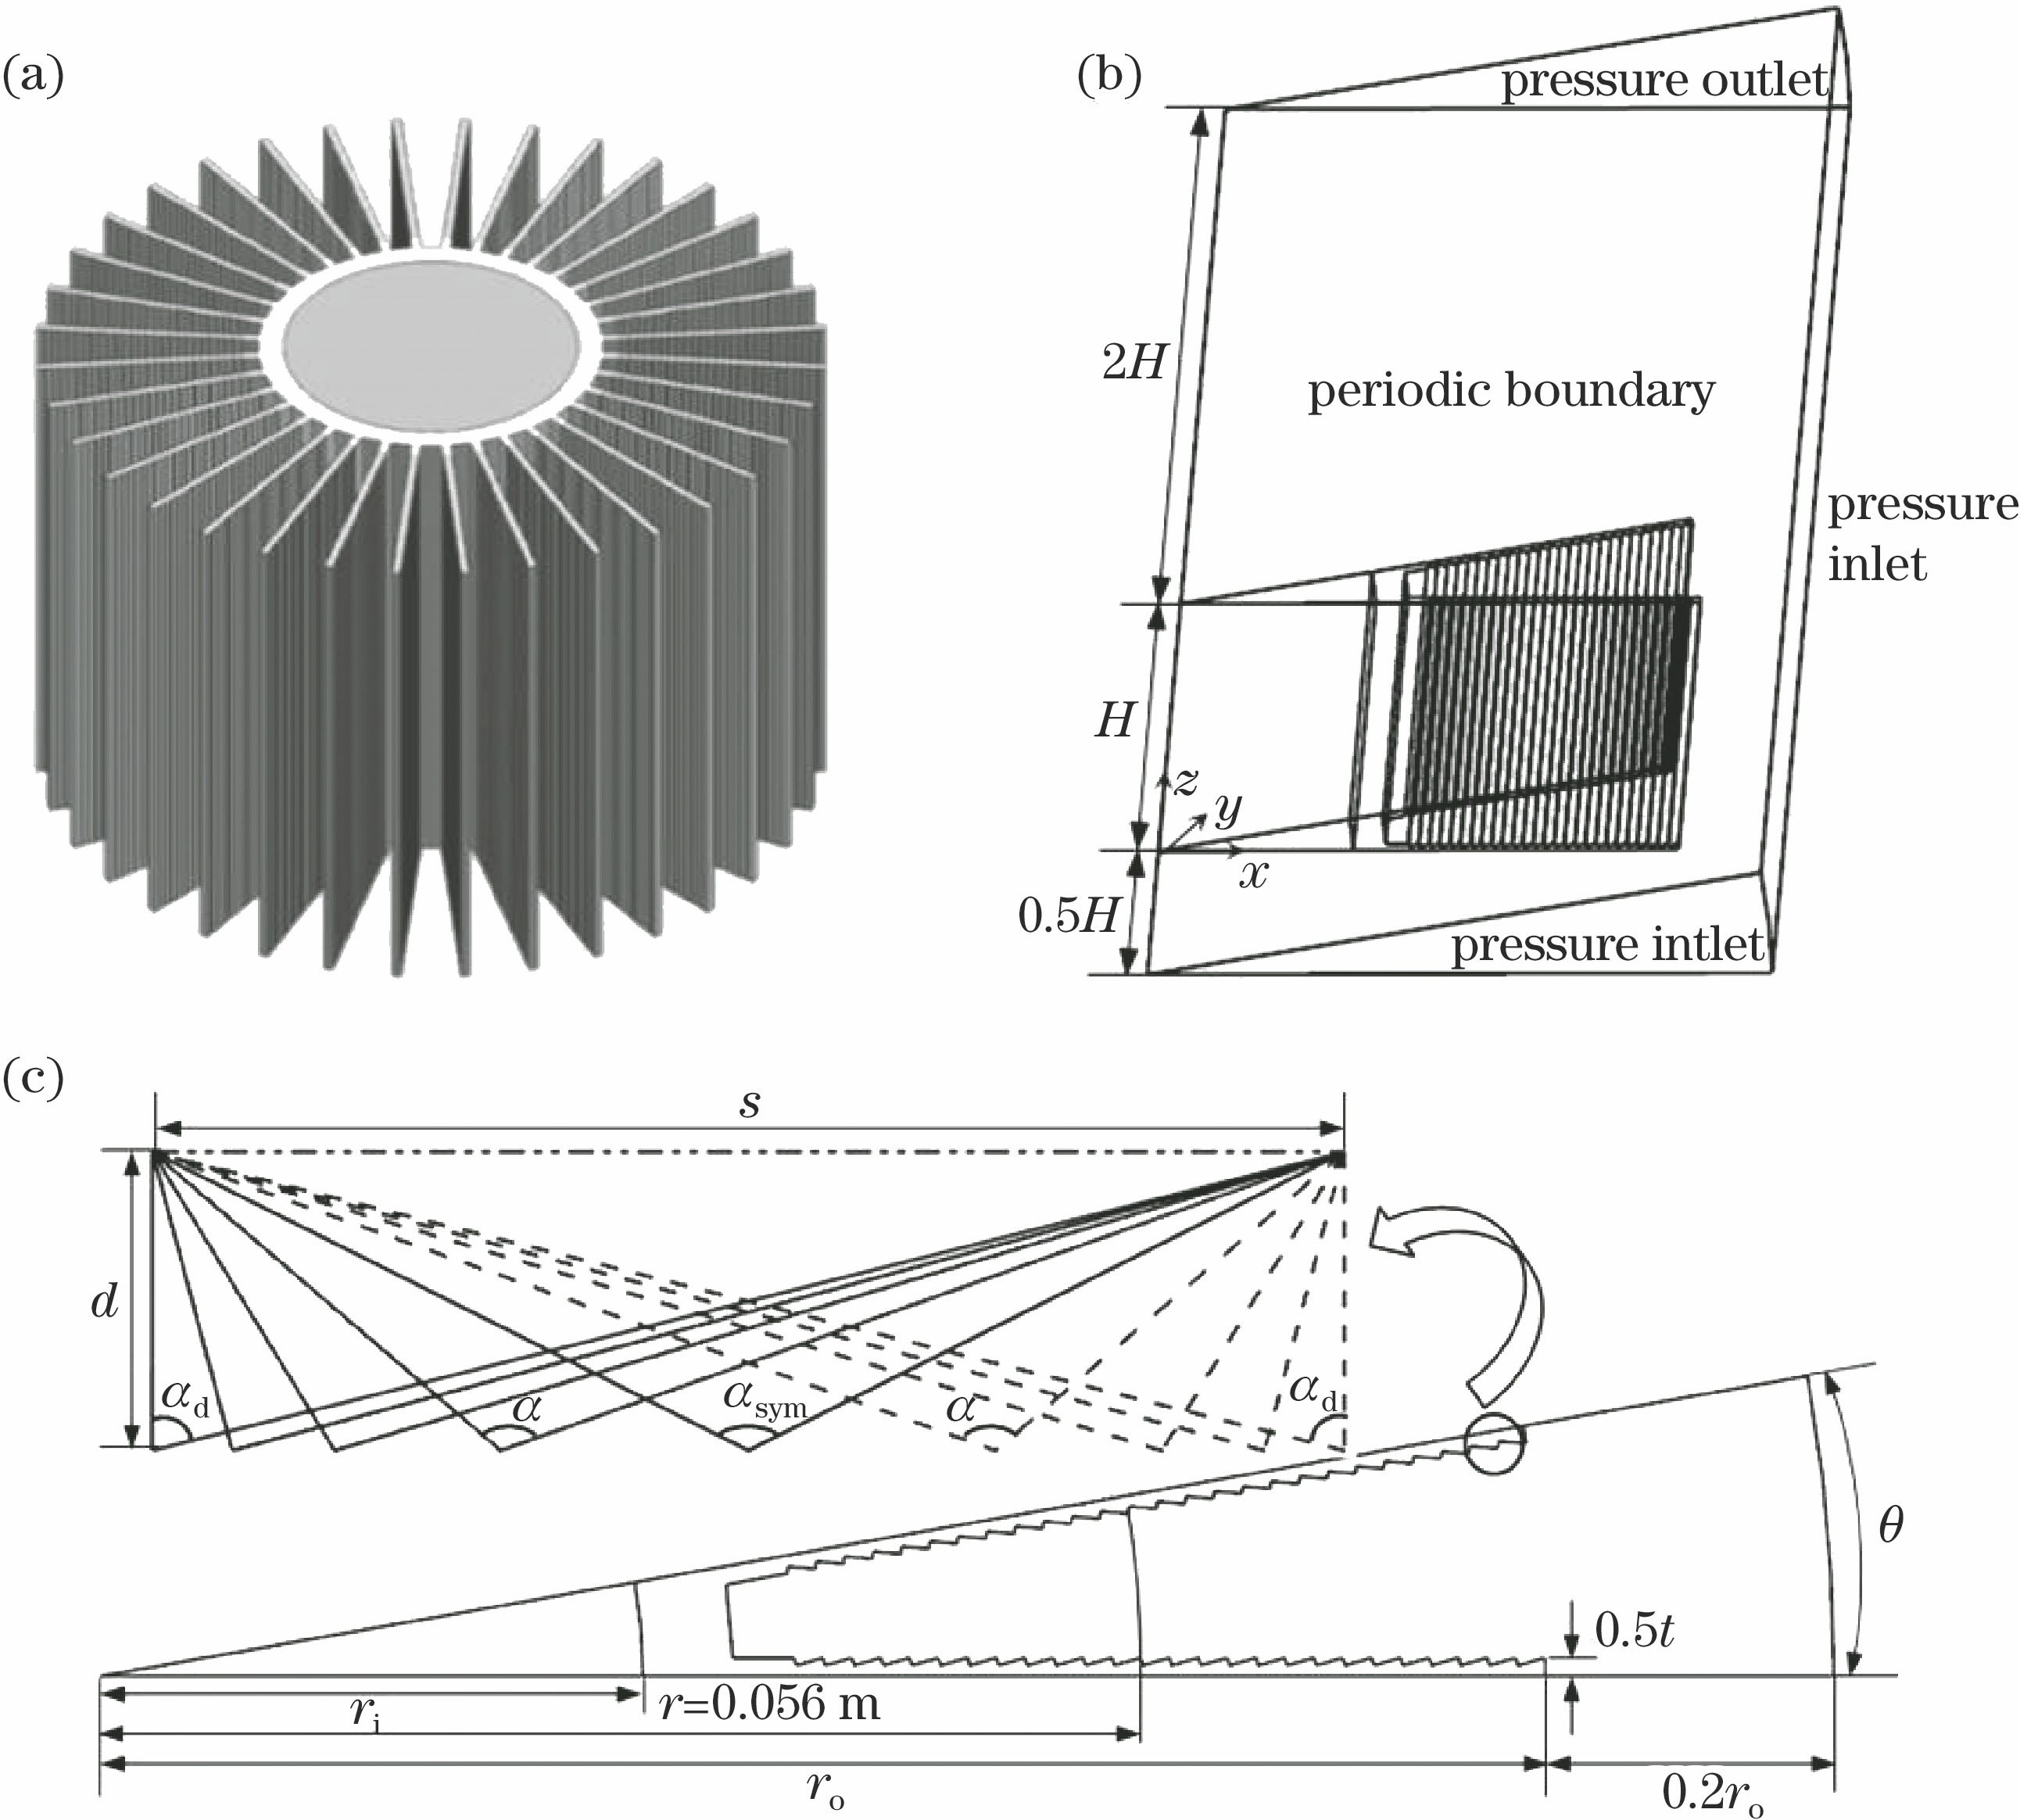
Fig. 1. Schematic of LED sunflower radiator and computational domains. (a) Structural diagram of sunflower radiator; (b) side view of computational domain; (c) top view of computational domain
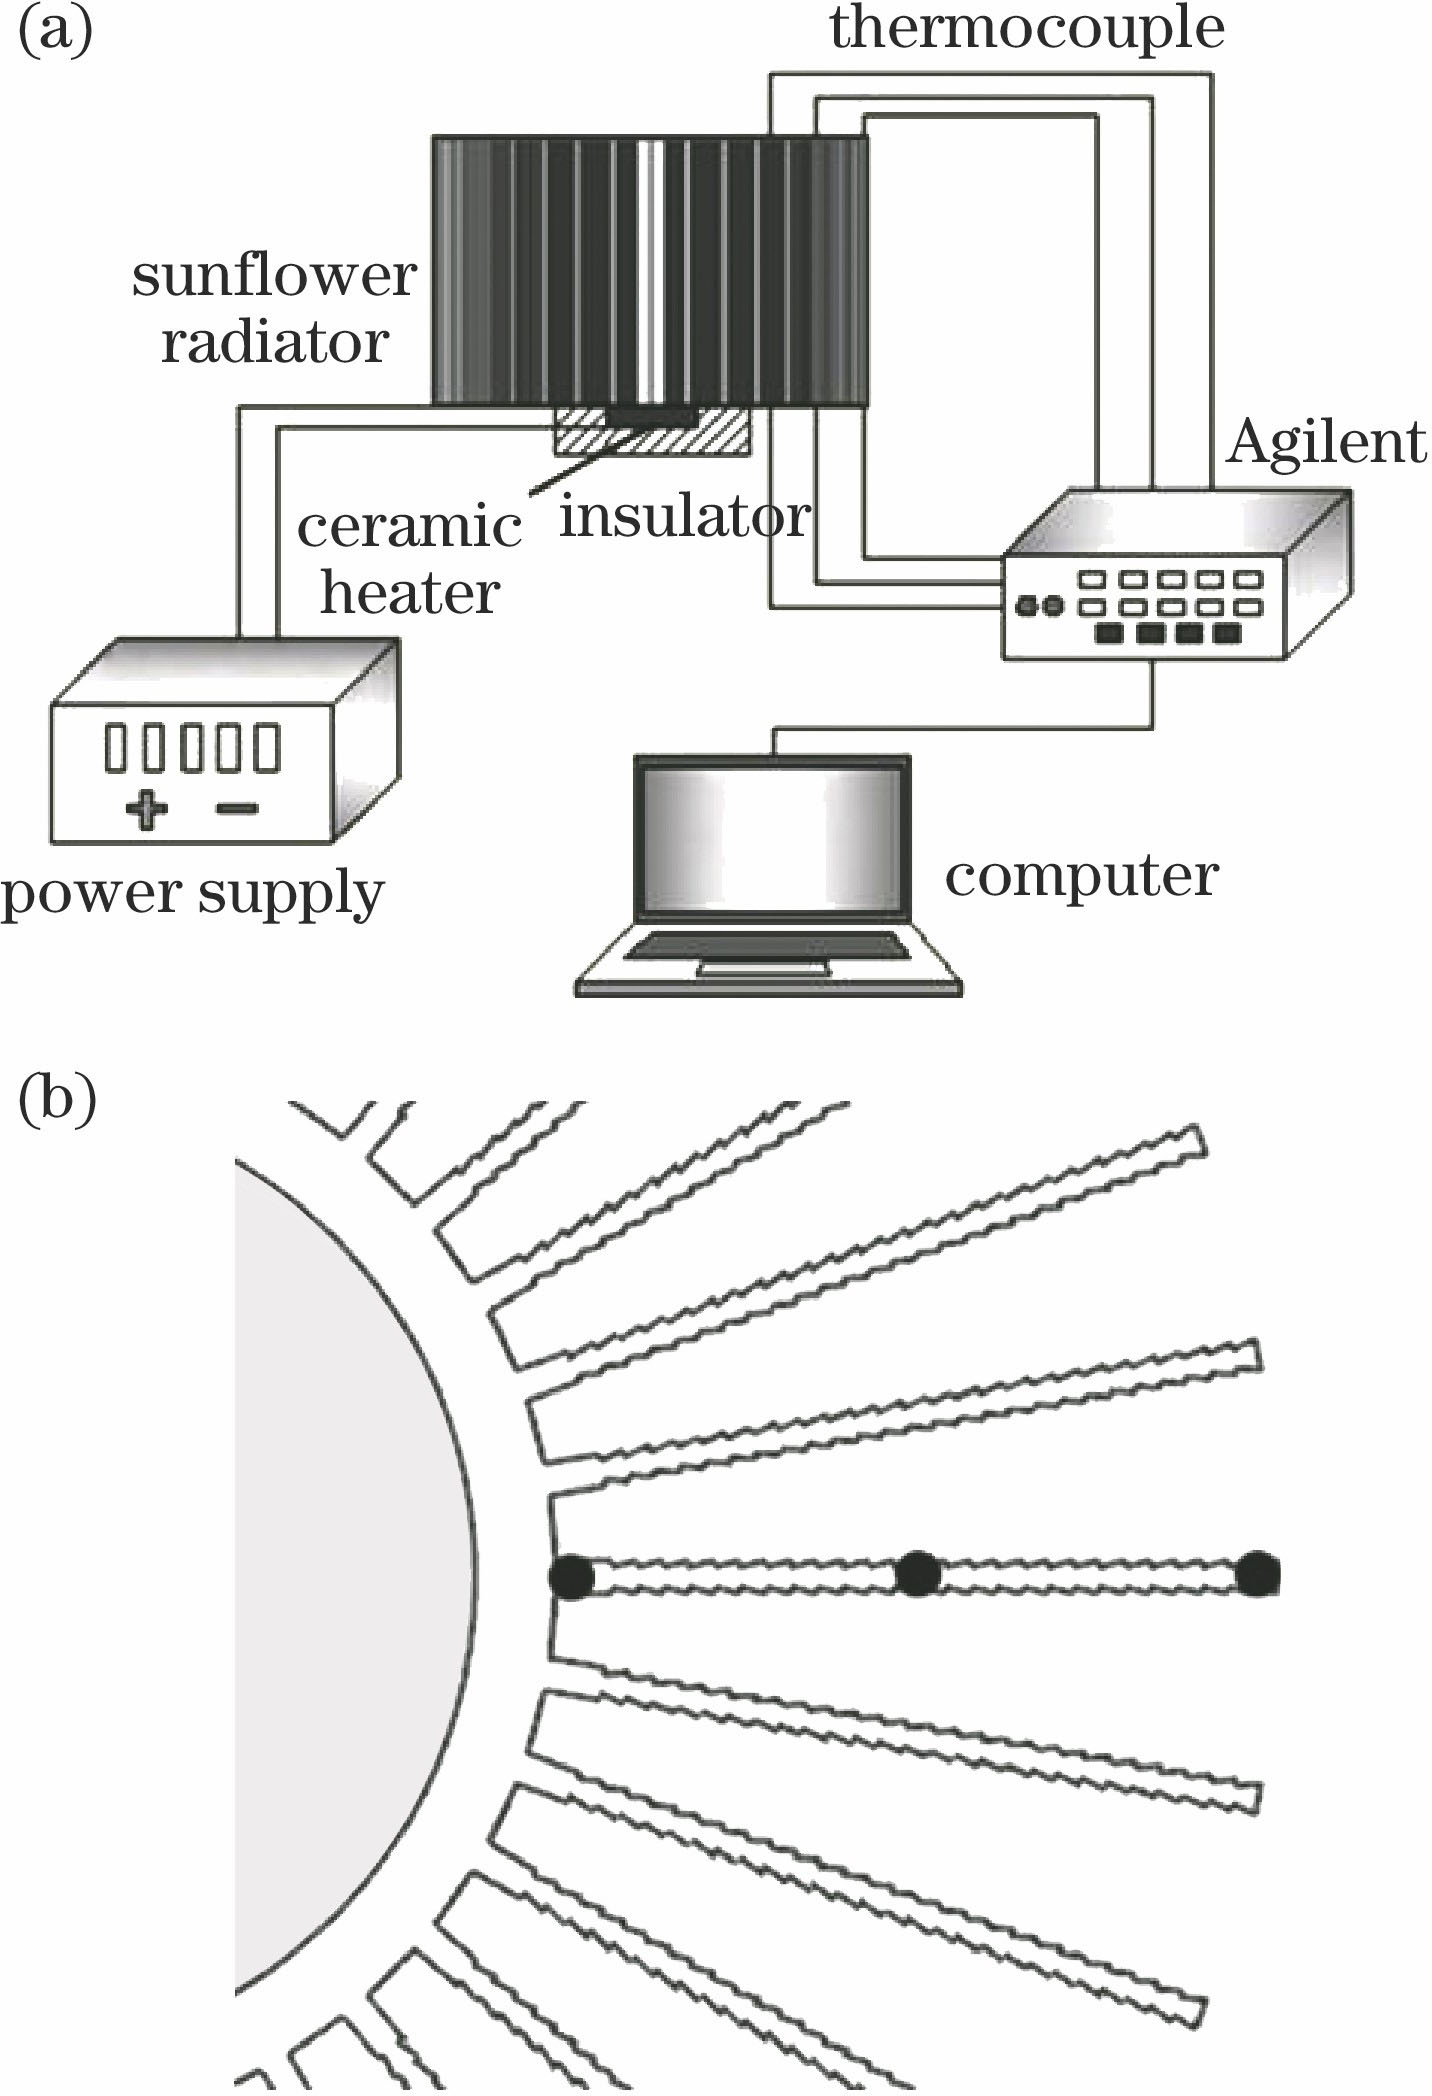
Fig. 2. Schematic of experimental system. (a) Experiment platform; (b) temperature measurement points
Fig. 3. Comparison between experimental and simulation results
Fig. 4. Effect of α on ΔTmax
Fig. 5. Effect of α on h and R. (a) Effect of α on h; (b) effect of α on R
Fig. 6. Effect of α on fluid velocity distribution at r=0.056 m. (a) α<0; (b) α>0
Fig. 7. Triangular grooves with different groove widths
Fig. 8. Effect of s on ΔTmax
Fig. 9. Effect of s on h and R
Fig. 10. Effect of s on fluid velocity distribution at r=0.056 m
Fig. 11. Triangular grooves with different groove depths
Fig. 12. Effect of d on ΔTmax
Fig. 13. Effect of d on h and R
Fig. 14. Effect of d on fluid velocity distribution at r=0.056 m
|
Table 1. Structural parameters of triangular grooves on fin surface

Set citation alerts for the article
Please enter your email address
© Copyright 2018-2021 | Chinese Laser Press. All Rights Reserved 沪ICP备15018463号-20