
Kang Shen, Songde Liu, Junhui Shi, Chao Tian. Dual-Domain Neural Network for Sparse-View Photoacoustic Image Reconstruction[J]. Chinese Journal of Lasers, 2022, 49(5): 0507017
- Chinese Journal of Lasers
- Vol. 49, Issue 5, 0507017 (2022)
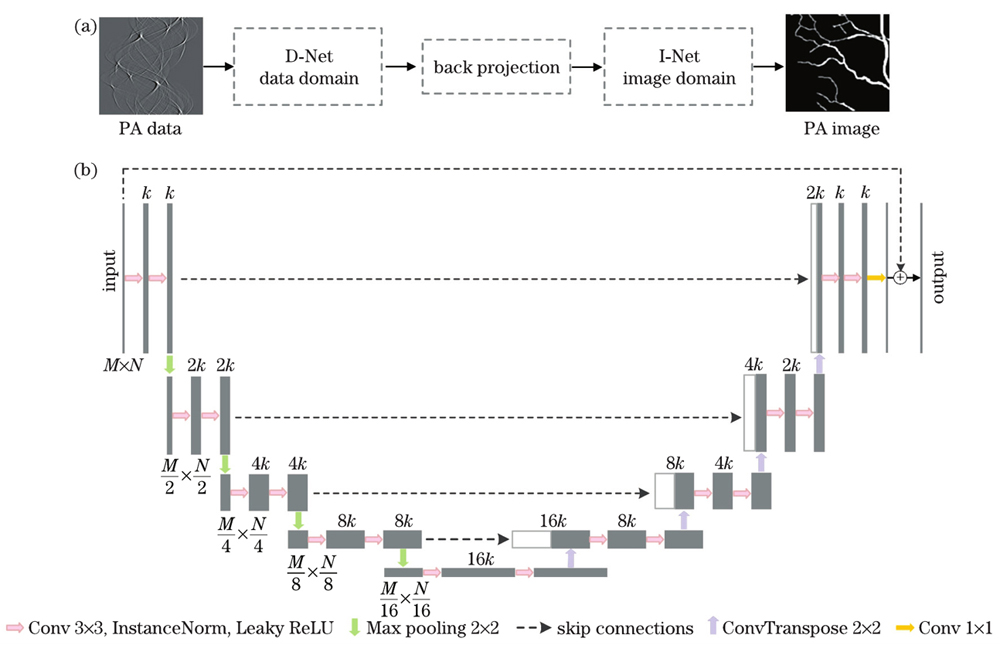
Fig. 1. Network structure of DI-Net. (a) Overall schematic of DI-Net; (b) network structure of D-Net (M=512,N=768,k=16) and I-Net (M=256,N=256,k=32)
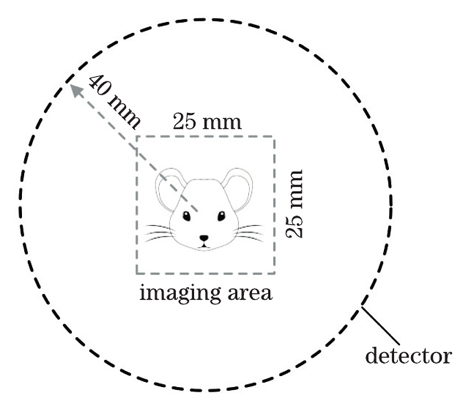
Fig. 2. Schematic of the experimental setup
Fig. 3. Reconstruction results of vascular phantom based on 128 projection views (All color bars stand for amplitudes of pixels on images). (a) Reference image; (b)(d) images reconstructed by FBP algorithm, Post-Unet algorithm, and DI-Net algorithm, respectively; (e)(g) difference images between the reference image and the images reconstructed by FBP, Post-Unet, and DI-Net, respectively; (d) quantitative evaluation results of the reconstruction images
Fig. 4. Reconstruction results of vascular phantom based on 256 projection views (All color bars stand for amplitudes of pixels on images). (a) Reference image; (b)(d) images reconstructed by FBP algorithm, Post-Unet algorithm, and DI-Net algorithm, respectively; (e)(g) difference images between the reference image and the images reconstructed by FBP, Post-Unet, and DI-Net, respectively; (d) quantitative evaluation results of the reconstruction images
Fig. 5. Quantitative evaluation results of different algorithms on the vascular test dataset (To facilitate observation, the ordinate of the boxplot in the small dashed box is stretched and separately shown in the large dashed box). (a)(d) MSE; (b)(e) PSNR; (c)(f) SSIM
Fig. 6. Reconstruction results of mouse slice based on 128 projection views (All color bars stand for amplitudes of pixels on images). (a) Reference image; (b)(d) images reconstructed by FBP algorithm, Post-Unet algorithm, and DI-Net algorithm, respectively; (e)(g) difference images between the reference image and the images reconstructed by FBP, Post-Unet, and DI-Net, respectively; (d) quantitative evaluation results of the reconstruction images
Fig. 7. Reconstruction results of mouse slice based on 256 projection views (All color bars stand for amplitudes of pixels on images). (a) Reference image; (b)(d) images reconstructed by FBP algorithm, Post-Unet algorithm, and DI-Net algorithm, respectively; (e)(g) difference images between the reference image and the images reconstructed by FBP, Post-Unet, and DI-Net, respectively; (d) quantitative evaluation results of the reconstruction images
Fig. 8. Quantitative evaluation results of different algorithms on the mouse slice test dataset. (a)(d) MSE; (b)(e) PSNR; (c)(f) SSIM
|
Table 1. Mean value of quantitative evaluation results for different algorithms on the vascular test dataset
|
Table 2. Mean value of quantitative evaluation results for different algorithms on the mouse slice test dataset
|
Table 3. Comparisons of consuming time for different algorithms unit:s

Set citation alerts for the article
Please enter your email address
© Copyright 2018-2021 | Chinese Laser Press. All Rights Reserved 沪ICP备15018463号-20