1State Key Laboratory of Advanced Optical Communication Systems and Networks, School of Physics and Astronomy, Shanghai Jiao Tong University, Shanghai 200240, China
2Collaborative Innovation Center of IFSA (CICIFSA), Shanghai Jiao Tong University, Shanghai 200240, China
Bei Jiang, Hailang Dai, Xianfeng Chen, "Enhancement of stimulated emission by a metallic optofluidic resonator," Photonics Res. 6, 597 (2018)
Copy Citation Text
Stimulated emission can be controlled by a material molecular energy band and the intensity of a pump laser, which can provide some population inversion and promote ground electron transition, respectively. We use a metallic optofluidic resonator to enhance stimulated emission intensity. The quality factor and the spontaneous emission coupling factor of the metallic optofluidic resonator are discussed in detail to explain the enhancement mechanism. Experimental data demonstrate that the operated emission from rhodamin 6G solution can be observed due to the enhancement of stimulated emission from the optofluidic resonator.
In optics and solid-state physics research fields, optical microcavities hold great promise because they can confine the resonant modes to very small volumes [1]. The small cavity volume with high factor gives new avenues in the pursuit of efficient and compact laser sources with low power dissipation [2]. The microcavity or even nanocavity plays a vital part in laser applications. For example, the stimulated emissions based on a whispering gallery microcavity (WGM) [3], photonic-crystal nanocavity [4], droplets [5], and semiconductor cavity [6] are already demonstrated due to the significant progress in the lasing process. Compared with the no cavity case, the spontaneous emission rate is enhanced in the weak coupling regime, which is called the Purcell effect [7]. The microcavity’s coupling factor is proportional to the inverse of the microcavity volume, i.e., the mode volume [8]. As increases, the pump threshold behavior gradually disappears. A thresholdless laser is theoretically possible when is approximately equal to 1 [9]. Therefore, microcavity or nanocavity structures are most favored in the design of lasers with a high stimulated emission ratio.
This paper adopts a macroscale optofluidic waveguide cavity whose dimension is much larger than wavelength scale as a resonant cavity. The specific hollow-core metal-cladding waveguide (HCMW) structure is introduced to enhance the interaction between the gain medium and the resonant modes. Since the resonant cavity in the waveguide chip is in millimeter scale, the ultrahigh order modes (UOMs) can exist in the guiding layer. When the incident angle is very small, a standing optical field is formed between the coupling and substrate layers, resulting in high sensitivity, factor, and power density, which provide great application potential in biosensing [10], integrated optical components [11], etc. The intrinsic energy shift between adjacent modes in the HCMW can be explained by the inter-mode coupling effect [12], so increasing the ratio of spontaneous emission into lasing modes for all resonant modes may be realized. In our experiment, the optofluidic resonator with rhodamine 6G (R6G) solution is pumped by a continuous laser, and the threshold intensity is very low. In addition, our chip is easy to fabricate with low costs, and it is anticipated to open new avenues for lab-on-chip or optofluidic integration.
2. METALLIC OPTOFLUIDIC RESONATOR
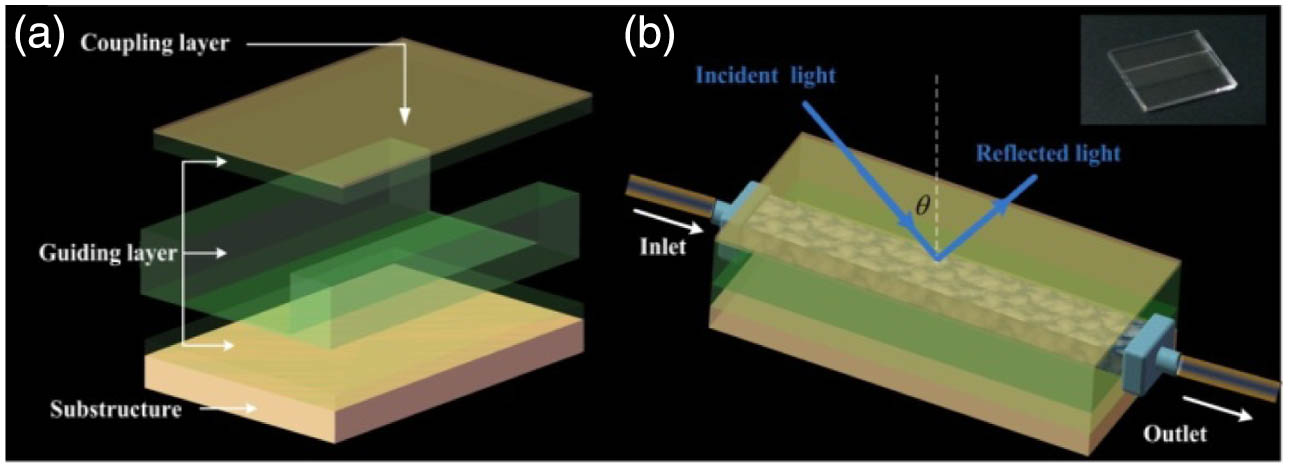
Our resonant cavity’s factor is extremely high, which benefits from the millimeter-scale metal cladding optical waveguide structure. As Fig. 1(a) shows, the HCMW is composed of a silver coupling layer with a thickness of 30–50 nm, a silver substrate with 300 nm, and a guiding layer containing a 1.1 mm thick channel for dye solution. The two silver claddings have excellent optical parallelism. Different from a Fabry–Perot cavity, the effective refractive index of excited guided modes in the HCMW can approach zero. In Fig. 1(b), direct coupling from the free space without a high refractive index prism becomes possible, and no propagating plasmon wave is involved [13]. Due to the field enhancement effect, the UOMs oscillate with high power density in the guiding layer. Numerical simulations verify that the Poynting vector of the modes can be 60 times enhanced of the incident light [14], so the mode density for photons in the resonant UOMs is high. Therefore, the difference of the transverse wave vector between two adjacent modes is small [12], and the stimulated emission can be significantly enhanced by cavity resonance. Furthermore, the full width at half-maximum (FWHM) of each resonance dip is extremely small, resulting in a high factor value. Theoretically, the factor is of orders.
Sign up for Photonics Research TOC. Get the latest issue of Photonics Research delivered right to you!Sign up now
Figure 1.(a) Schematic of the HCMW chip. The thickness of the coupling layer is about 30–50 nm, and the metal substrate is about 300 nm thick. The guiding layer that contains a channel for dye solution is 1.1 mm thick. (b) Excitation of UOMs via free-space coupling technique. The right inset shows the image of the HCMW chip before vacuum evaporation.
It is widely accepted that the lasing threshold power is inversely proportional to the and factors for microcavity lasing. Especially, a thresholdless lasing requires that the value approaches 1, which corresponds to a closed cavity. Since is proportional to the inverse of the mode volume, the microcavity draws more attention than a large cavity whose dimensions are much larger than the wavelength of light. In the following part, we will show that our structure is completely different from the conventional Fabry–Perot configuration, and it has a high factor and a relatively high value, which contribute to the enhancement of stimulated emission. As a concrete illustration, a simple three-layer structure is assumed for the sake of simplicity, and the parameters used in this example are: the dielectric constant of the silver is , the thickness of the coupling layer is 45 nm, and the thickness of the guiding layer is with dielectric constant .
A. High Q Factor
The numerically calculated reflectivity is shown in Fig. 2 for the simplified model described above, where the FWHM of the extremely sharp resonant peak is about 0.0026 nm. It is possible to estimate the factor via . For the specific UOM in Fig. 2, whose central wavelength is 560.14 nm, its factor is about . Since the parameters used in the illustration are close to the parameters in our experiments, the theoretical estimation of the factor for the experimental illustrations should be of orders.
Figure 2.Numerically calculated reflectivity spectrum of the simplified HCMW structure, whose parameters are presented above. Inset: Reflectivity spectrum in the range of 540–610 nm, which corresponds to the fluorescence spectrum of the R6G.
In order to carry out the experimental measurement of the factor, we need to vary the wavelength of the laser continuously. Thus, we did the experimental measurement via a tunable laser (Toptica Photonics DL100) of 859 nm, and the results are presented below.
Since the applied wavelength in the factor measurement is different, we carried out numerical simulation via the transfer matrix method. In Fig. 3, the measured FWHM is 0.08 nm, while the simulated one is 0.05 nm. In addition, the factors are and for experimental measurement and theoretical calculation, respectively. The small difference may be attributed to the Gaussian beam used in the experiment instead of the planar wave and the absorption that was neglected in theoretical calculation. However, the factor is of the same order of magnitude, which demonstrates the validity of the transfer matrix method.
Figure 3.(a) Experimental measurement of the wavelength-dependent resonance dip of the waveguide chip. (b) Numerical simulation by transfer matrix method.
The cavity dimension of the HCMW chip is much larger than the wavelength of light, so the mode volume cannot be simply replaced by the cavity volume. It should be recalculated carefully. Since the field distribution of the high-order mode is oscillating in the vertical direction of the surface in the whole guiding layer, and the observed perfect reflection cone indicates an excited mode propagating along all the directions, it is reasonable to deduce that the UOMs occupy a series of concentric cylinders in the cavity. Therefore, we need to consider only the attenuation coefficient, i.e., the imaginary part of the propagation constant of each mode.
Here, the attenuation of the mode is caused mainly by absorption of the metal films, i.e., the permittivity of metal is complex, and hence, the perturbation method is applied. First, we calculate the propagation constant of the three-layer structure without considering the metallic absorption. The propagation constant is related to the effective refractive index by , where is the incident wavelength. The effective refractive index can be solved numerically from the dispersion equation: where , and is the mode order. Now we consider the metallic absorption as a perturbation and replace the permittivity of metal with ; then the effective refractive index becomes where is already solved from Eq. (1). Comparing the dispersion equation of the layered structure with and without metallic absorption, and through algebraic deduction, we have
Then the imaginary part of propagation constant can be obtained as and the radius of the cylindrical mode volume is
With the above results, we can go on calculating value, which simply corresponds to the solid angle at which an atom sees the cavity mirrors at the cylinder center; it follows where is defined by
For a more accurate model that contains the leakage loss, the imaginary part of propagation constant would be larger, which leads to a smaller value.
C. Numerical Calculation of the Reflected Light Cones in HCMW
In our waveguide chip, the value is also high. As increases, the pump intensity decreases and the thresholdless laser could be achieved in the limit, which corresponds to a closed cavity. In order to reduce mode volume and increase , various micro-cavity structures are investigated and applied. In our HCMW structure, the value of the mode volume is not equal to the cavity volume. Analytically, we calculate the volume of the guided mode, and the expression of could be proposed. Numerical simulations are carried out to calculate the value for different mode orders . In the case of , the effective refractive index of the mode is , and the value is found to be 0.1461. For , the effective refractive index is , and the value equals 0.1455. For , the effective refractive index is , and the value is 0.1417. As a contrast, the value of a plane mirror Fabry–Perot configuration is about 0.1. It is worth mentioning that the value does not vary too much as the mode order changes. At the same time, this high value confirms that the stimulated emission ratio could be greatly enhanced by the structure.
Let us now discuss the physical mechanism behind the reflection cones (Fig. 4), which is related to the amplified stimulated emission from the resonant cavity of the waveguide chip. When the incident laser illuminates on the chip surface, the energy of light is coupled into the guided layer and stored as guided modes. Since the coupling metallic layer is relatively thin, all these UOMs are leaky modes. To each UOM with a fixed transverse wave vector, a concentric light cone can be observed as its energy converting back to free space through leakage radiation. The bright spot on the screen is caused by specular reflection of the incident light. As a consequence, one collimated beam should excite only one UOM because of the same transverse wave vector. However, a series of reflection cones appears, while each one corresponds to a UOM. That is to say, after the incident light is coupled and stored in the guiding layer, leakage radiation takes place via all UOM channels, while each mode leakage produces a reflection cone. Under the situation of a dye laser, the emission process through the resonant cavity is similar, and we can observe a series of concentric cones in our following experiment.
Figure 4.(a) Schematic of the reflected light cones formed by leakage radiation of the UOMs, while the reflection law generates the spectra reflected beam. (b) Image of the light cones on a screen, where a bright spot corresponding to the reflected beam can be found.
The experimental setup to verify the above hypothesis is shown in Fig. 5(b). The pump was a continuous-wave diode pumped solid state laser (DPSS) of 15 mW at 473 nm wavelength. An optical fiber and a spectrometer were used to collect and measure the output emission, respectively. A goniometer was used to adjust the incident angle for the investigation of the relation between lasing emission and UOMs coupling. One representative laser dye, R6G solution with a concentration of , was adopted as the active medium in order to decrease collision probability and avoid fluorescent quenching. Note that we do not need to consider the triplet state issue due to the extremely low concentration used in our experiments, as shown in Fig. 5(a).
Figure 5.(a) Energy level diagram of R6G. (b) Schematic of the experimental setup of the optofluidic dye laser.
In Fig. 6(a), the image on the screen shows that a series of red cones corresponding to the lasing wavelength exists, which was explained as the lasing emission process. It is similar to the UOMs leakage process, i.e., the energy converts back to free space via all the UOM channels. In Fig. 6(b), a transverse shift in the incident plane is discernable between the blue cones’ axis and the red cones’ axis. This implies that the center of the excited UOMs and the lasing is slightly shifted in the guiding layer. Lasing of 568 nm was observed in Fig. 6(c) via R6G laser dye, whose fluorescence spectrum ranges from 550 nm to 600 nm. The lasing threshold of R6G dye is determined to be around μ. The experiment results verify the enhancement effect of the HCMW chip. In Fig. 6(d), the experiment result shows the intensity of R6G emitted from HCMW is almost two orders of magnitude larger than the spectrum emitted from the cuvette, which fully benefits from the UOM in the HCMW.
Figure 6.(a) Image of the concentric laser cones (red) and the leakage cones of the UOMs (blue) on the screen. (b) Schematic of a specific laser cone and a specific leakage cone of a UOM, where a transverse shift between the two cones’ axes occurs in the incident plane. (c) Emission spectrum of the R6G sample, where the lasing wavelength is 568 nm. The inset figure shows that the lasing threshold of R6G dye is about μ. (d) Fluorescence spectra of R6G solution with concentration of emitted from HCMW (black line) and cuvette (red line), respectively.
We have proposed a novel optofluidic resonator based on a millimeter-scale waveguide cavity to enhance the stimulated emission intensity. Theoretically, numerical simulations illustrated that the HCMW features high and values that benefit from the UOMs. The physical mechanism was discussed in detail. Experimentally, the optofluidic resonator with R6G solution was pumped by a continuous laser at room temperature, and lasing of 568 nm was observed. A series of concentric lasing cones was achieved by the coherent light emission, which is in accordance with the leakage radiations of the UOMs. There was a transverse shift between the output lasing cones and the UOMs leakage cones. Considering the attributes mentioned above, the HCMW is anticipated to open up new prospects for optofluidics and integration optics.