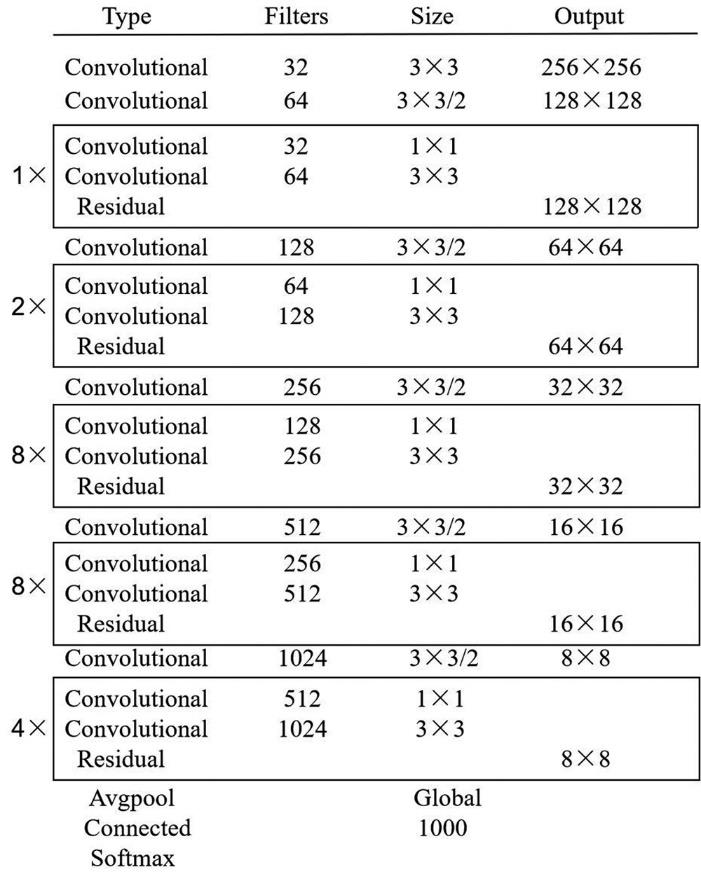
Fig. 1. Darknet-53 structure
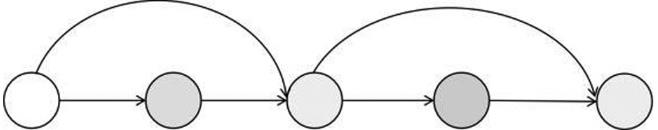
Fig. 2. Residual structure connection mode
Fig. 3. Dense connection structure
Fig. 4. Improved network structure
Fig. 5. Comparison of LIoU, LGIoU, and LDIoU
Fig. 6. Clustering results of RSOD remote sensing image dataset
Fig. 7. Clustering results of DIOR remote sensing image dataset
Fig. 8. Clustering results of partial TGRS-HRRSD remote sensing image dataset
Fig. 9. Comparison of detection results. (a) Original pictures; (b) detection results of YOLOv3; (c) test results of proposed method
Category | Training set | Verification set | Test set |
---|
Airplane | 344 | 338 | 705 | Airport | 326 | 327 | 657 | Baseball field | 551 | 577 | 1312 | Basketball court | 336 | 329 | 704 | Bridge | 379 | 495 | 1304 | Chimney | 202 | 204 | 448 | Dam | 238 | 246 | 502 | Expressway service area | 279 | 281 | 565 | Expressway toll station | 285 | 299 | 634 | Golf course | 216 | 239 | 491 | Ground track field | 536 | 454 | 1322 | Harbor | 328 | 332 | 814 | Overpass | 410 | 510 | 1099 | Ship | 650 | 652 | 1400 | Stadium | 289 | 292 | 619 | storage tank | 391 | 384 | 839 | Tennis court | 605 | 630 | 1347 | Train station | 244 | 249 | 501 | Vehicle | 1556 | 1558 | 3306 | Wind mill | 404 | 403 | 809 | Total | 5862 | 5863 | 11738 |
|
Table 1. Numbers of images in training set, verification set, and test set of each category
Category | Training set | Verification set | Test set |
---|
Playground | 37 | 34 | 78 | Overpass | 44 | 44 | 88 | Oiltank | 41 | 41 | 83 | Aircraft | 111 | 112 | 223 | Total | 233 | 231 | 472 |
|
Table 2. Numbers of images in training set, verification set, and test set of each category
Category | Training set | Verification set | Test set |
---|
Airplane | 75 | 75 | 150 | Ship | 50 | 50 | 100 | Total | 125 | 125 | 250 |
|
Table 3. Numbers of images in training set, verification set, and test set of each category
Parameter | SSD(300×300)[15] | SSD(512×512)[15] | Faster RCNN[1] | YOLOv3[5] | Ours |
---|
AP /% | Airplane | 49.1 | 59.5 | 53.6 | 72.2 | 75.9 | Airport | 62.1 | 72.7 | 49.3 | 29.2 | 39.3 | Baseball field | 66.2 | 72.4 | 78.8 | 74.0 | 77.8 | Basketball court | 72.0 | 75.7 | 66.2 | 78.6 | 82.7 | Bridge | 26.1 | 29.7 | 28.0 | 31.2 | 38.6 | Chimney | 63.3 | 65.8 | 70.9 | 69.7 | 72.7 | Dam | 54.0 | 56.6 | 62.3 | 26.9 | 34.9 | Expressway service area | 62.7 | 63.5 | 69.0 | 48.6 | 53.7 | Expressway toll station | 46.6 | 53.1 | 55.2 | 54.4 | 58.5 | Golf course | 64.8 | 65.3 | 68.0 | 31.1 | 40.8 | Ground track field | 53.1 | 68.6 | 56.9 | 61.1 | 64.2 | Harbor | 44.2 | 49.4 | 50.2 | 44.9 | 48.3 | Overpass | 34.7 | 48.1 | 50.1 | 49.7 | 59.7 | Ship | 44.4 | 59.2 | 27.7 | 87.4 | 91.7 | Stadium | 58.3 | 61.0 | 73.0 | 70.6 | 74.9 | Storage tank | 42.1 | 46.6 | 39.8 | 68.7 | 73.2 | Tennis court | 72.6 | 76.3 | 75.2 | 87.3 | 90.9 | Train station | 37.4 | 55.1 | 38.6 | 29.4 | 36.7 | Vehicle | 22.7 | 27.4 | 23.6 | 48.3 | 54.8 | Wind mill | 47.1 | 65.7 | 45.4 | 78.7 | 81.9 | mAP /% | 51.2 | 58.6 | 54.1 | 57.1 | 62.6 | Time /s | 0.021 | 0.032 | 0.180 | 0.024 | 0.042 |
|
Table 4. Test results of different models on DIOR dataset
Parameter | SSD(300×300)[15] | SSD(512×512)[15] | Faster RCNN[1] | YOLOv3[5] | Ours |
---|
AP /% | Aircraft | 68.0 | 86.1 | 76.2 | 89.7 | 91.6 | Oiltank | 90.5 | 90.6 | 94.3 | 90.5 | 92.6 | Playground | 90.3 | 90.4 | 96.0 | 90.2 | 91.8 | Overpass | 77.3 | 73.3 | 69.1 | 63.3 | 68.7 | mAP /% | 81.5 | 85.1 | 83.9 | 83.4 | 86.2 | Time /s | 0.021 | 0.034 | 0.180 | 0.024 | 0.042 |
|
Table 5. Test results of different models on RSOD dataset
Parameter | SSD(300×300) [15] | SSD(512×512)[15] | Faster RCNN[1] | YOLOv3[5] | Ours |
---|
AP /% | Ship | 85.0 | 85.3 | 80.3 | 86.1 | 92.1 | Airplane | 87.4 | 89.9 | 94.1 | 90.0 | 92.5 | mAP /% | 86.2 | 87.6 | 87.2 | 88.0 | 92.3 | Time /s | 0.024 | 0.034 | 0.183 | 0.026 | 0.040 |
|
Table 6. Test results of different models on partial TGRS-HRRSD dataset