• Acta Optica Sinica
  • Vol. 39, Issue 1, 0126007 (2019)
Sizuo Luo*, Zhou Chen, Xiaokai Li, Zhan Hu, and Dajun Ding**
Author Affiliations
  • State Key Laboratory of Applied Atomic and Molecular Spectroscopy, Institute of Atomic and Molecular Physics, Jilin University, Changchun, Jilin 130012, China
  • show less
    DOI: 10.3788/AOS201939.0126007 Cite this Article Set citation alerts
    Sizuo Luo, Zhou Chen, Xiaokai Li, Zhan Hu, Dajun Ding. Controlling Quantum States of Atoms and Molecules by Ultrafast Femtosecond Laser Fields[J]. Acta Optica Sinica, 2019, 39(1): 0126007 Copy Citation Text show less
    Characteristic time scale and corresponding energy of microscopic material motion, and the modern optical technology capable of achieving the corresponding time scale and photon energy
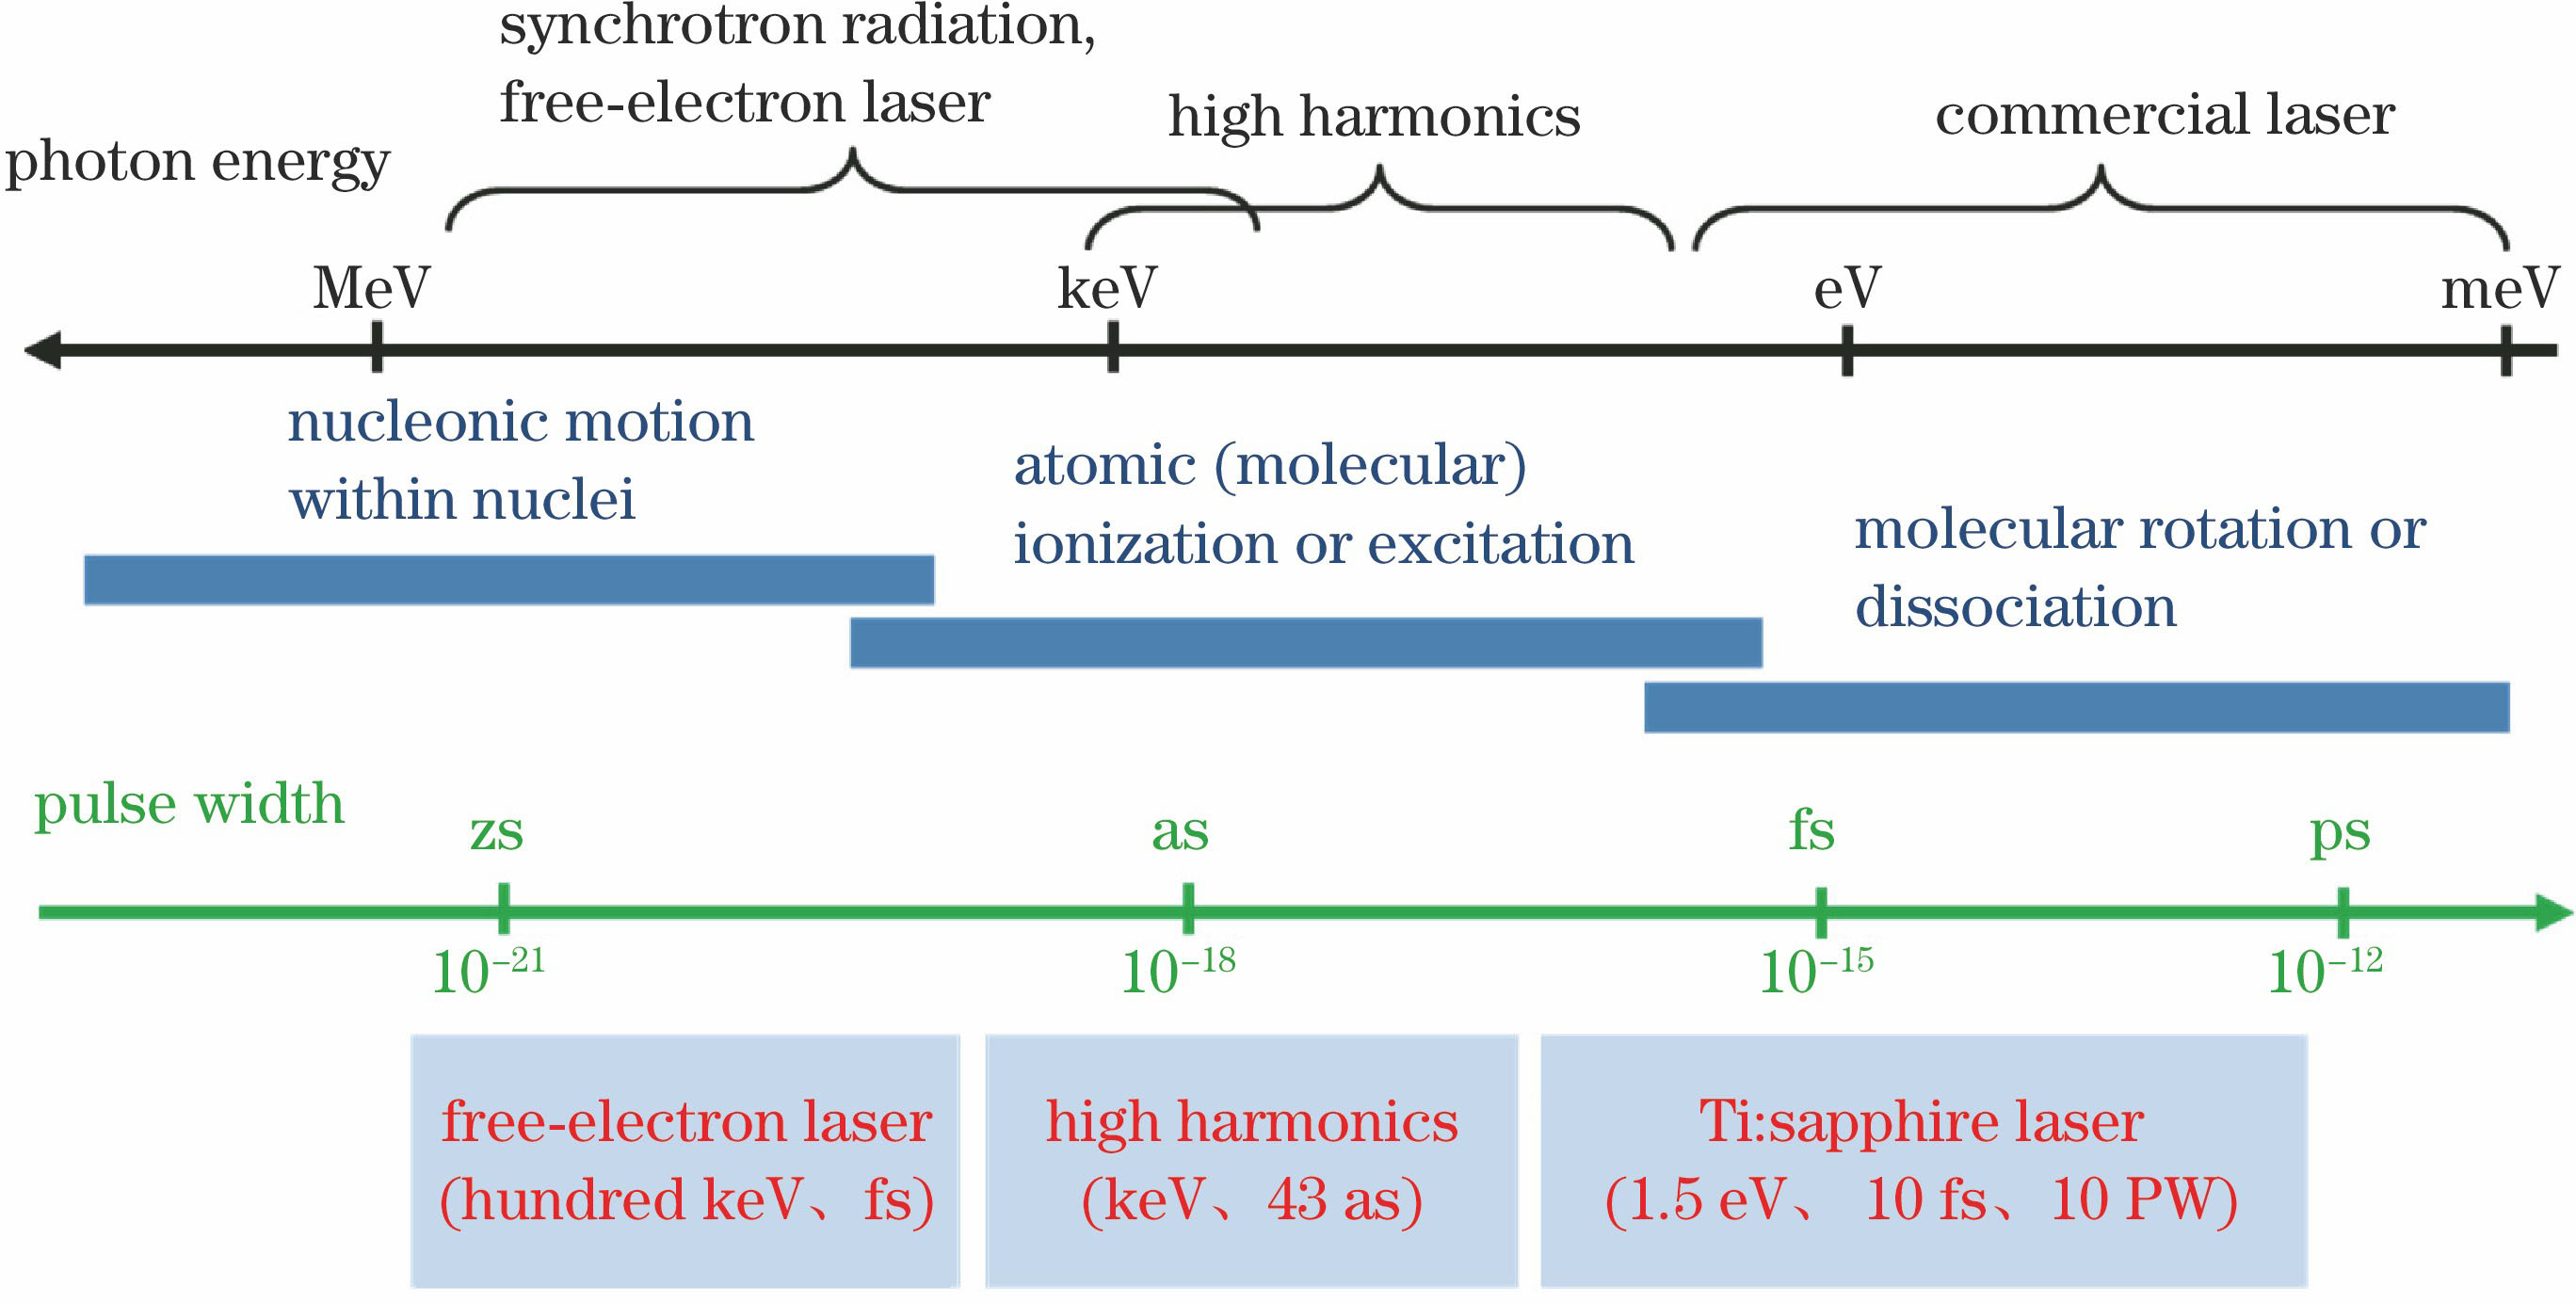
    Fig. 1. Characteristic time scale and corresponding energy of microscopic material motion, and the modern optical technology capable of achieving the corresponding time scale and photon energy
    Schematics of (a) molecular alignment, (b) orientation and (c) unidirectional rotation irradiated by ultrafast laser
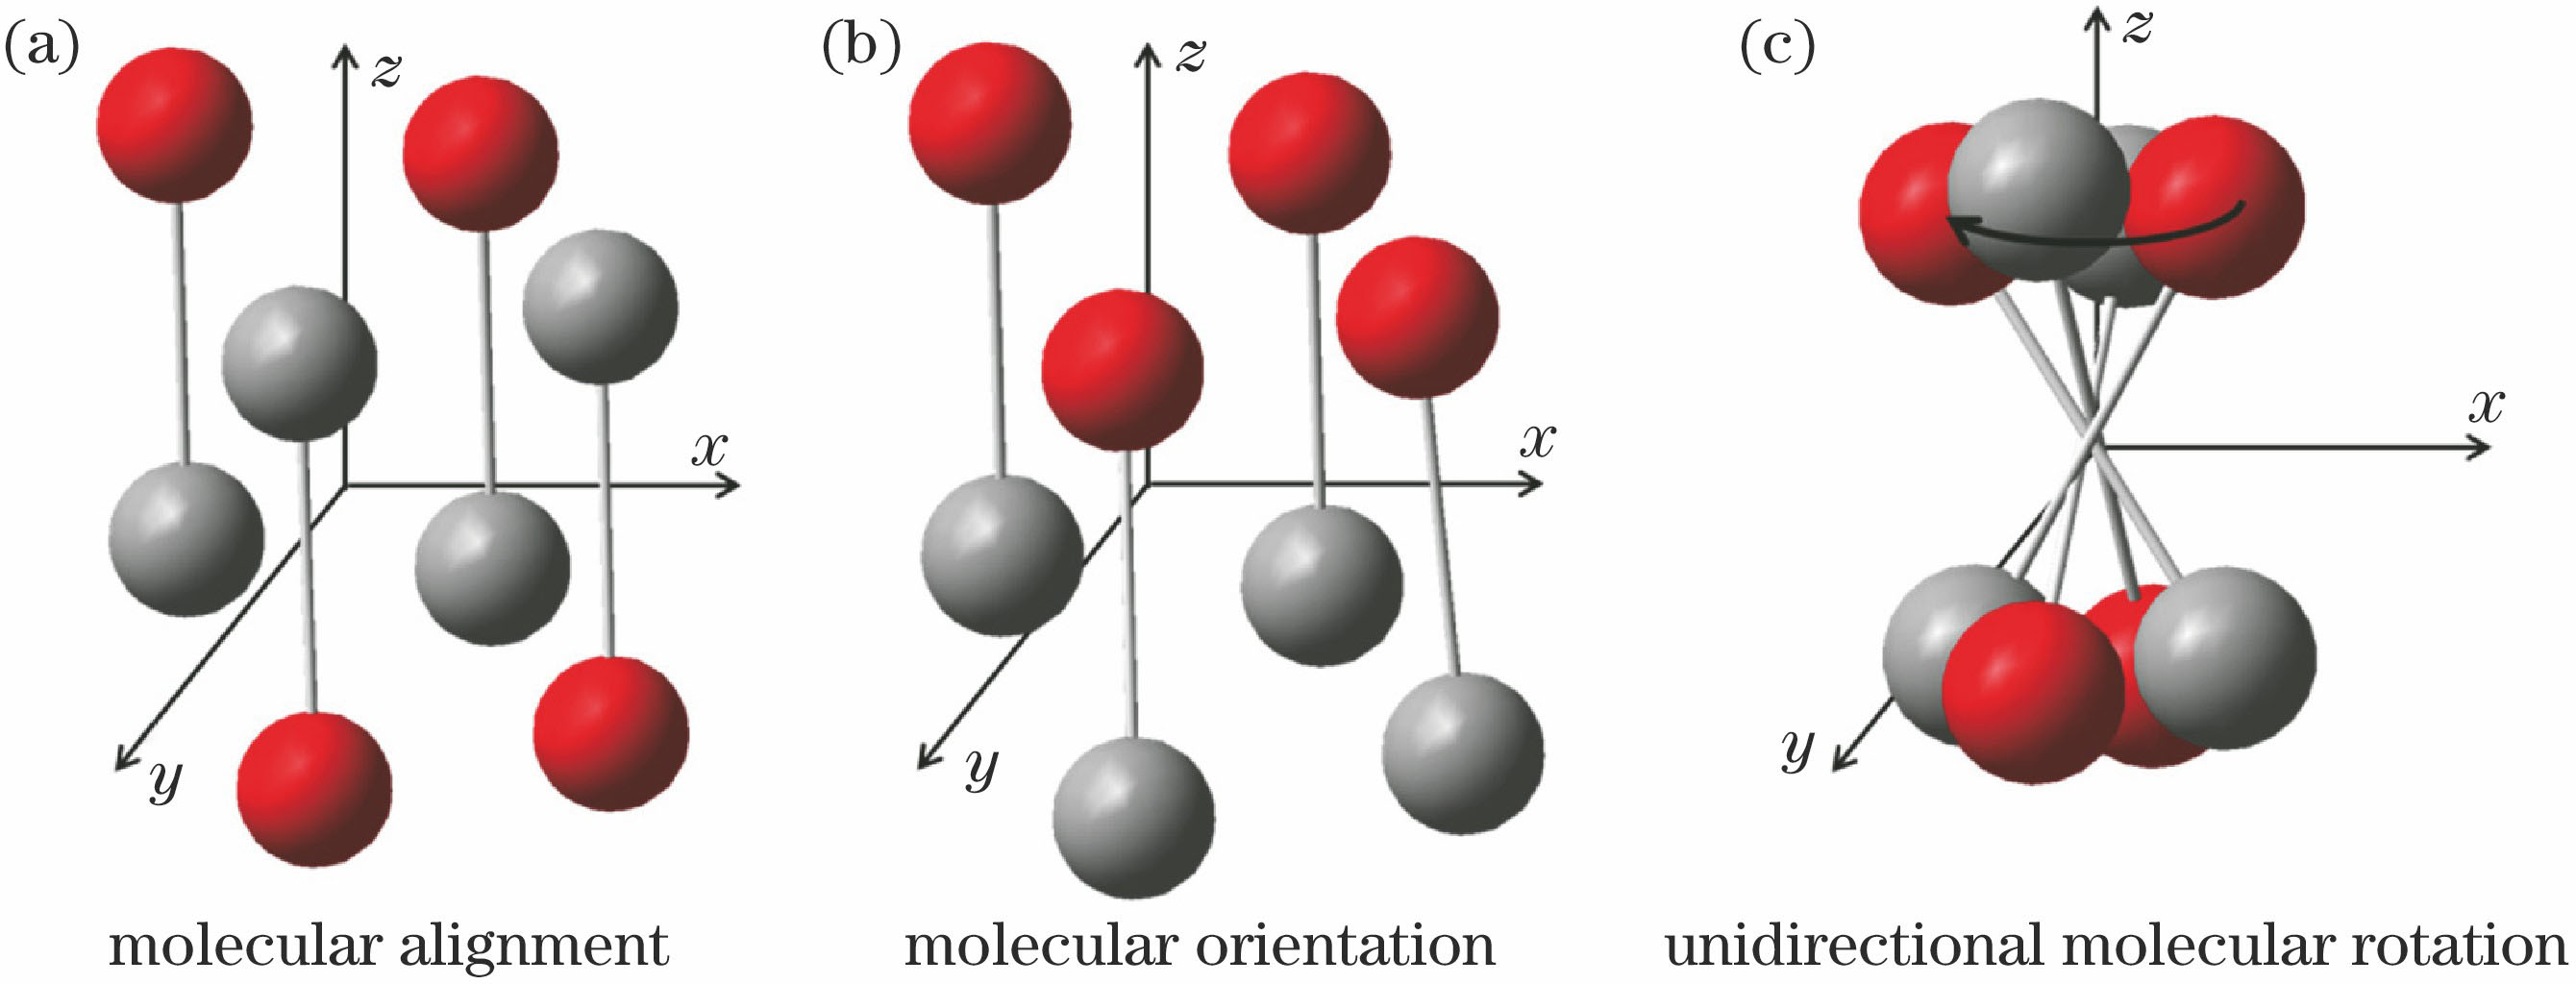
    Fig. 2. Schematics of (a) molecular alignment, (b) orientation and (c) unidirectional rotation irradiated by ultrafast laser
    (a)-(d) Molecular orientation evolution at different delay time irradiated by femtosecond lasers for rotational states selected methyl-bromide molecules and (e) evolution of the measured angular distribution of the alignment and orientation with different delay time and angle θ2D22
    Fig. 3. (a)-(d) Molecular orientation evolution at different delay time irradiated by femtosecond lasers for rotational states selected methyl-bromide molecules and (e) evolution of the measured angular distribution of the alignment and orientation with different delay time and angle θ2D22
    (a) Schematic of the quasi-three-dimensional polarization shaped light field. The laser propagates in the z direction, wherein red and blue respectively represents the components of the laser electric field in the x and y directions; (b) the projection of the laser electric field in the y direction; (c) the projection of the laser electric field in the x direction
    Fig. 4. (a) Schematic of the quasi-three-dimensional polarization shaped light field. The laser propagates in the z direction, wherein red and blue respectively represents the components of the laser electric field in the x and y directions; (b) the projection of the laser electric field in the y direction; (c) the projection of the laser electric field in the x direction
    Schematics of (a), (b) one-dimensional alignment and (c), (d) three-dimensional alignment[26]
    Fig. 5. Schematics of (a), (b) one-dimensional alignment and (c), (d) three-dimensional alignment[26]
    Molecular orientation irradiated by (a) the transform limit pulse and (b) the shaped pulse, and (c) intensity integration of the images; (d) the molecular orientation distribution under different laser conditions; (e), (f) time-dependent evolution (black line and points) and theoretical evolution (red lines); (g) the envelope of the optimal laser pulse[13]
    Fig. 6. Molecular orientation irradiated by (a) the transform limit pulse and (b) the shaped pulse, and (c) intensity integration of the images; (d) the molecular orientation distribution under different laser conditions; (e), (f) time-dependent evolution (black line and points) and theoretical evolution (red lines); (g) the envelope of the optimal laser pulse[13]
    Rotating Doppler shift spectra of unidirectional molecular rotation. (a), (d) only pumping light; (b), (e) the rotation directions of unidirectional molecular rotation and probe pulse with circular polarization are the same; (c), (f) the rotation directions of unidirectional molecular rotation and probe pulse with circular polarization are the opposite[36]
    Fig. 7. Rotating Doppler shift spectra of unidirectional molecular rotation. (a), (d) only pumping light; (b), (e) the rotation directions of unidirectional molecular rotation and probe pulse with circular polarization are the same; (c), (f) the rotation directions of unidirectional molecular rotation and probe pulse with circular polarization are the opposite[36]
    Measured ionization (black spots and gray squares correspond to single and double ionization) and fragmentation ((a) Red dots and blue squares correspond to CH++CH+ and C2H++H+ channels, (b) Red dots, blue squares and green triangles correspond to CH2++CH2+, C2H3++H+ and C2H2++H2+ channels, (c) Red dots and blue squares correspond to C2H3++ C2H3+ and CH3++C3H3+ channels.) yields as a function of CEP for different channels of (a) acetylene, (b) ethylene, and (c) 1,3-butadiene; the measured three-
    Fig. 8. Measured ionization (black spots and gray squares correspond to single and double ionization) and fragmentation ((a) Red dots and blue squares correspond to CH++CH+ and C2H++H+ channels, (b) Red dots, blue squares and green triangles correspond to CH2++CH2+, C2H3++H+ and C2H2++H2+ channels, (c) Red dots and blue squares correspond to C2H3++ C2H3+ and CH3++C3H3+ channels.) yields as a function of CEP for different channels of (a) acetylene, (b) ethylene, and (c) 1,3-butadiene; the measured three-
    (a) Schematic of structural imaging of C6H6 molecules using ultrafast-laser-induced electron diffraction, (b) experimental measured 2D electron momentum distribution, (c) molecular differential scattering cross sections from experiment (black dots) and theory (red line)[56]
    Fig. 9. (a) Schematic of structural imaging of C6H6 molecules using ultrafast-laser-induced electron diffraction, (b) experimental measured 2D electron momentum distribution, (c) molecular differential scattering cross sections from experiment (black dots) and theory (red line)[56]
    (a) Experimental measured photoelectron spectra of xenon for above-threshold ionization, the complete spectra are shown in the inset; (b) theoretical calculation results with Coulomb potential for the curves from bottom to top, respectively, the laser intensity is 8.0×10¹³ W/cm2; (c), (d) experimental and theoretical calculation results with two laser intensities (4.0×10¹³ W/cm2, 10.0×10¹³ W/cm2) at the wavelength of 2000 nm); (e) experimental results with two laser intensities at the wavelength
    Fig. 10. (a) Experimental measured photoelectron spectra of xenon for above-threshold ionization, the complete spectra are shown in the inset; (b) theoretical calculation results with Coulomb potential for the curves from bottom to top, respectively, the laser intensity is 8.0×10¹³ W/cm2; (c), (d) experimental and theoretical calculation results with two laser intensities (4.0×10¹³ W/cm2, 10.0×10¹³ W/cm2) at the wavelength of 2000 nm); (e) experimental results with two laser intensities at the wavelength
    Two-electron joint momentum spectrum induced by laser electron recollision. (a)-(d) GSZ model; (e)-(h) heliumlike model; (i)-(l) measured results[60]
    Fig. 11. Two-electron joint momentum spectrum induced by laser electron recollision. (a)-(d) GSZ model; (e)-(h) heliumlike model; (i)-(l) measured results[60]
    Ionization time of two electrons from Ar atoms irradiated by elliptical polarized laser, the ionization time of the first electron (blue) and the second electron (green) under (a) 7 fs and (b) 33 fs laser. The blue line in the figure is the theoretical calculation of the ionization time of the first electron, and the red, green, black dotted and black dash-dotted lines are the ionization time of the second electron calculated by different theoretical methods; (c) and (d) are the two electrons io
    Fig. 12. Ionization time of two electrons from Ar atoms irradiated by elliptical polarized laser, the ionization time of the first electron (blue) and the second electron (green) under (a) 7 fs and (b) 33 fs laser. The blue line in the figure is the theoretical calculation of the ionization time of the first electron, and the red, green, black dotted and black dash-dotted lines are the ionization time of the second electron calculated by different theoretical methods; (c) and (d) are the two electrons io
    Influence of atomic magnetic quantum number (m) on strong field ionization irradiated by elliptical polarized laser. The distributions of tunneling ionization diagram (a), electron initial momentum (b) and electron final state momentum (c) with m=-1. The distributions of tunneling ionization diagram (d), electron initial momentum (e) and electron final state momentum (f) with m=1[67]
    Fig. 13. Influence of atomic magnetic quantum number (m) on strong field ionization irradiated by elliptical polarized laser. The distributions of tunneling ionization diagram (a), electron initial momentum (b) and electron final state momentum (c) with m=-1. The distributions of tunneling ionization diagram (d), electron initial momentum (e) and electron final state momentum (f) with m=1[67]
    Sizuo Luo, Zhou Chen, Xiaokai Li, Zhan Hu, Dajun Ding. Controlling Quantum States of Atoms and Molecules by Ultrafast Femtosecond Laser Fields[J]. Acta Optica Sinica, 2019, 39(1): 0126007
    Download Citation