
Jiuxiang Lian, Bin Zhou, Yihong Wang, Jian Li. Measurement of Gas Concentration Under Strong Interference by Frequency Multiplexing Based on High-Frequency Reference Signal[J]. Acta Optica Sinica, 2020, 40(16): 1630001
- Acta Optica Sinica
- Vol. 40, Issue 16, 1630001 (2020)
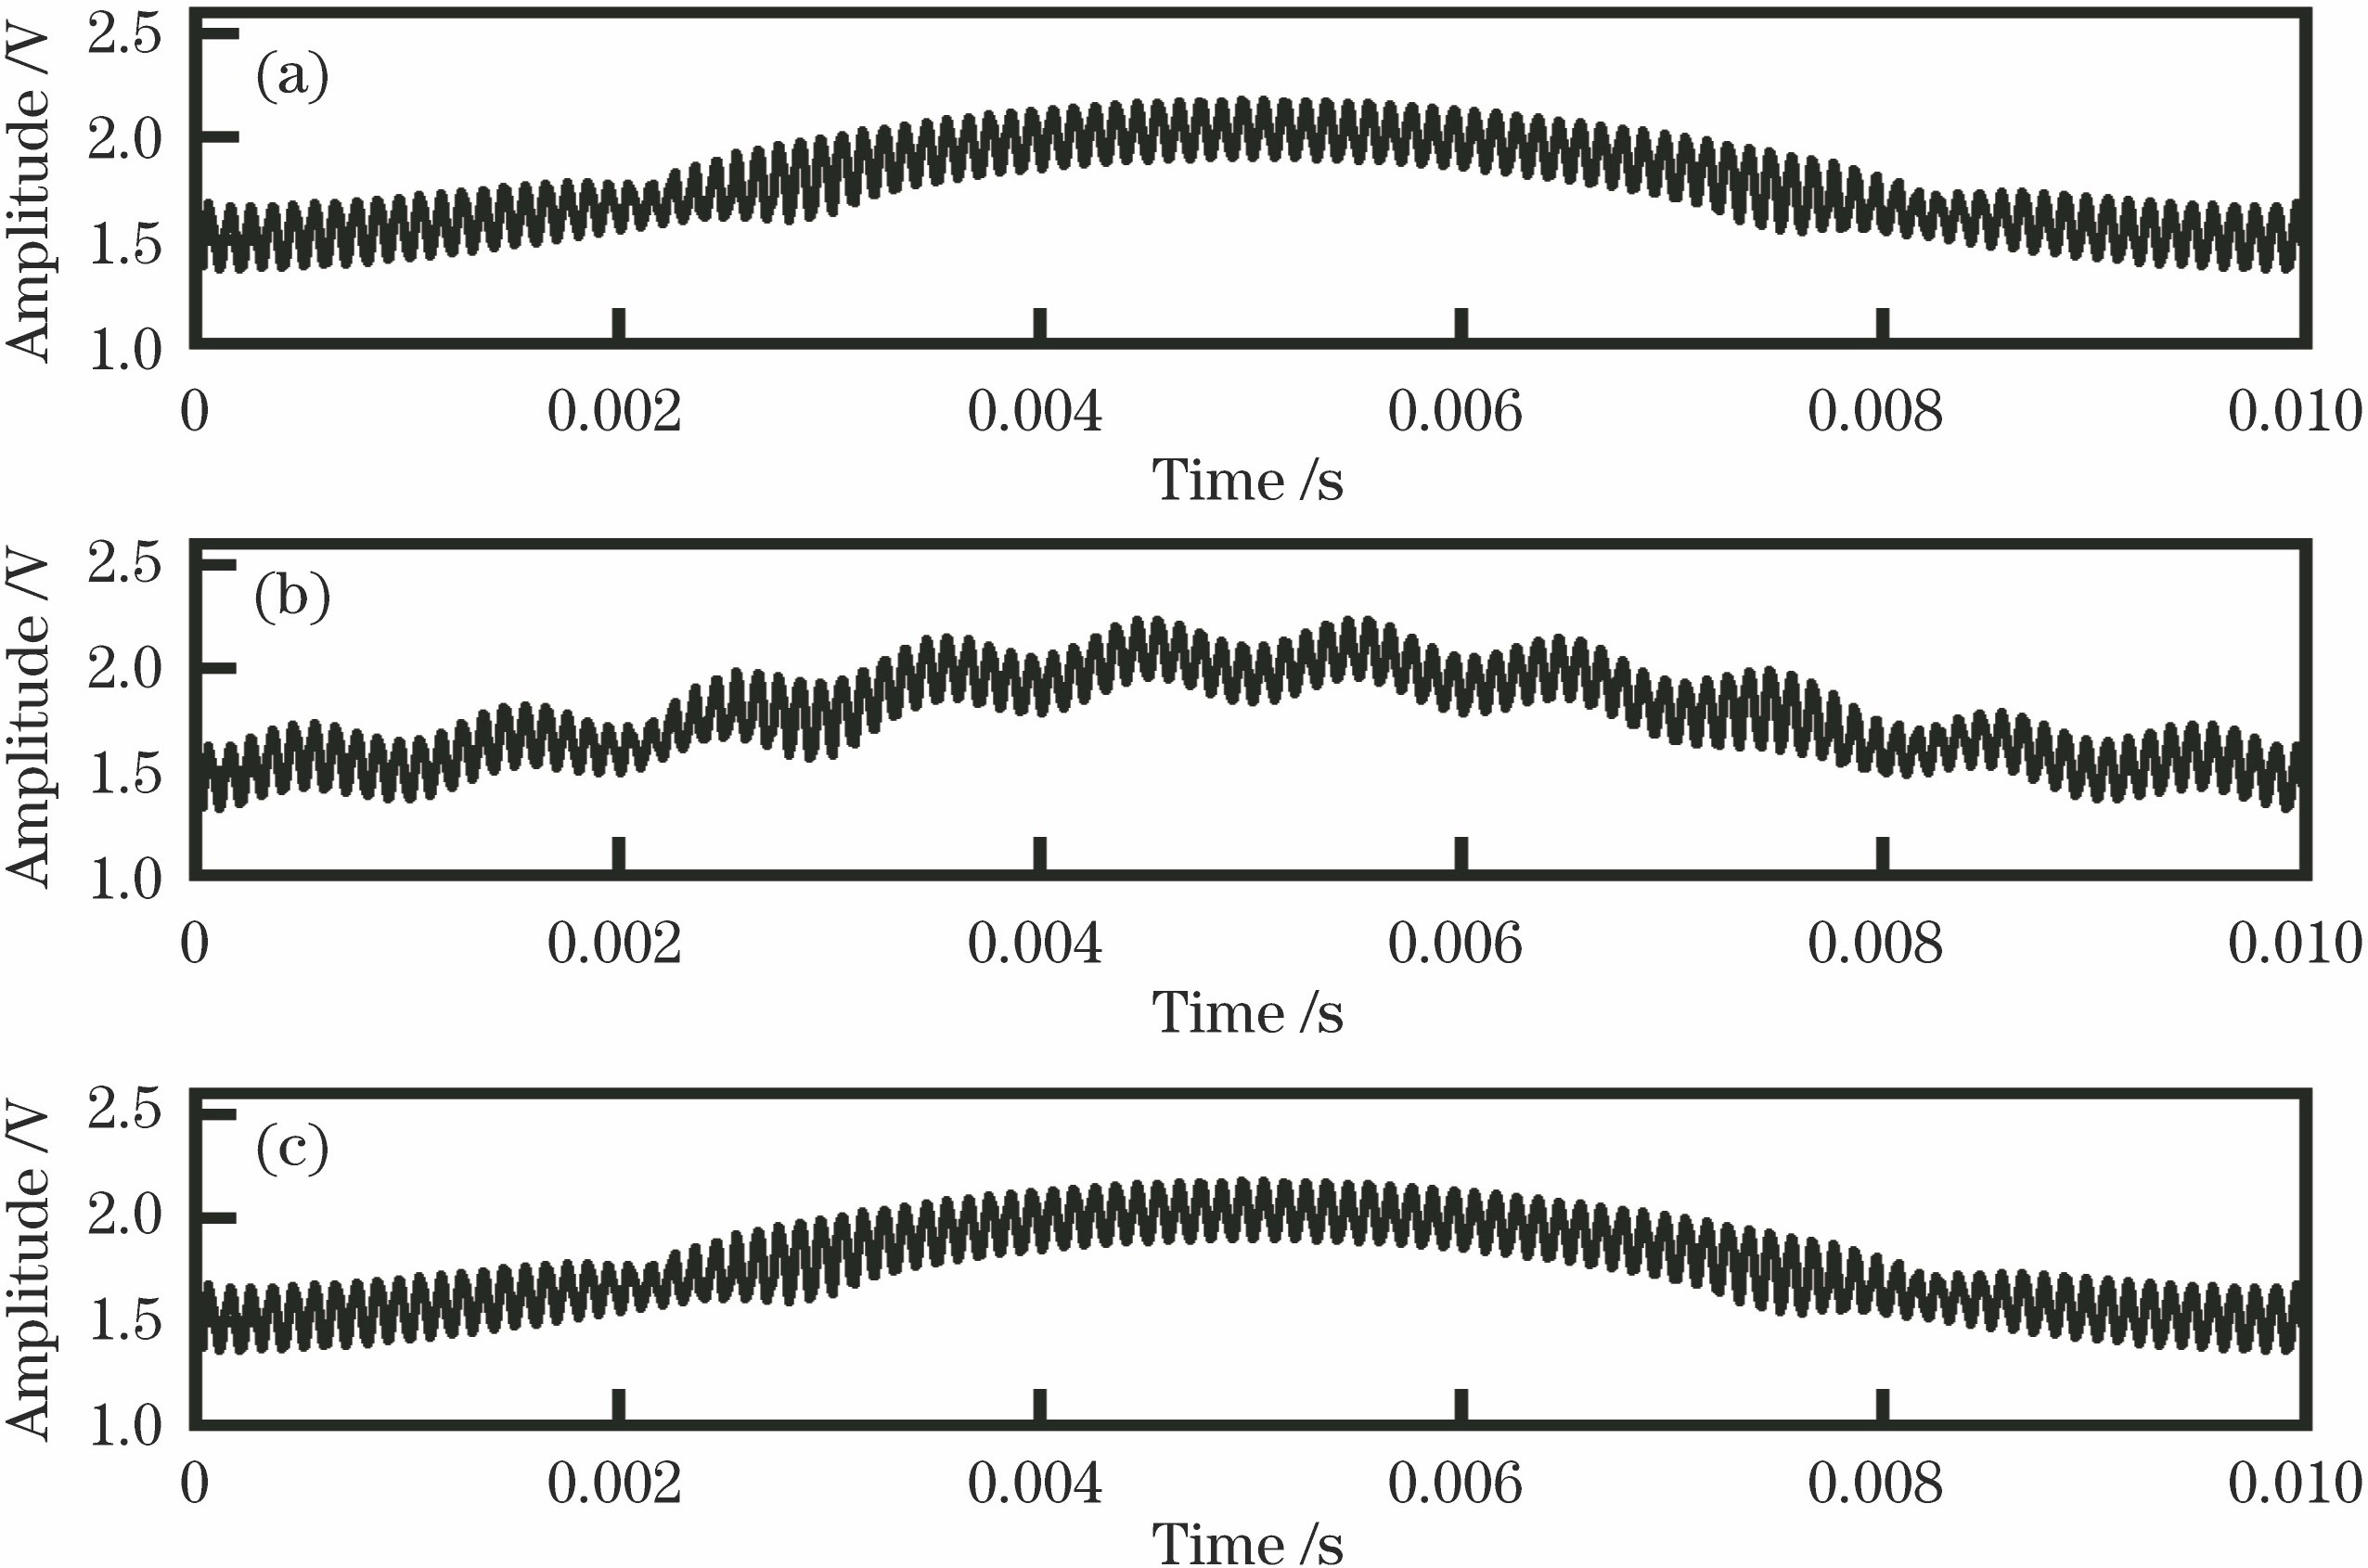
Fig. 1. Light intensity signals. (a) Interference-free light intensity signal; (b) interference (f=1 kHz) light intensity signal; (c) corrected light intensity signal
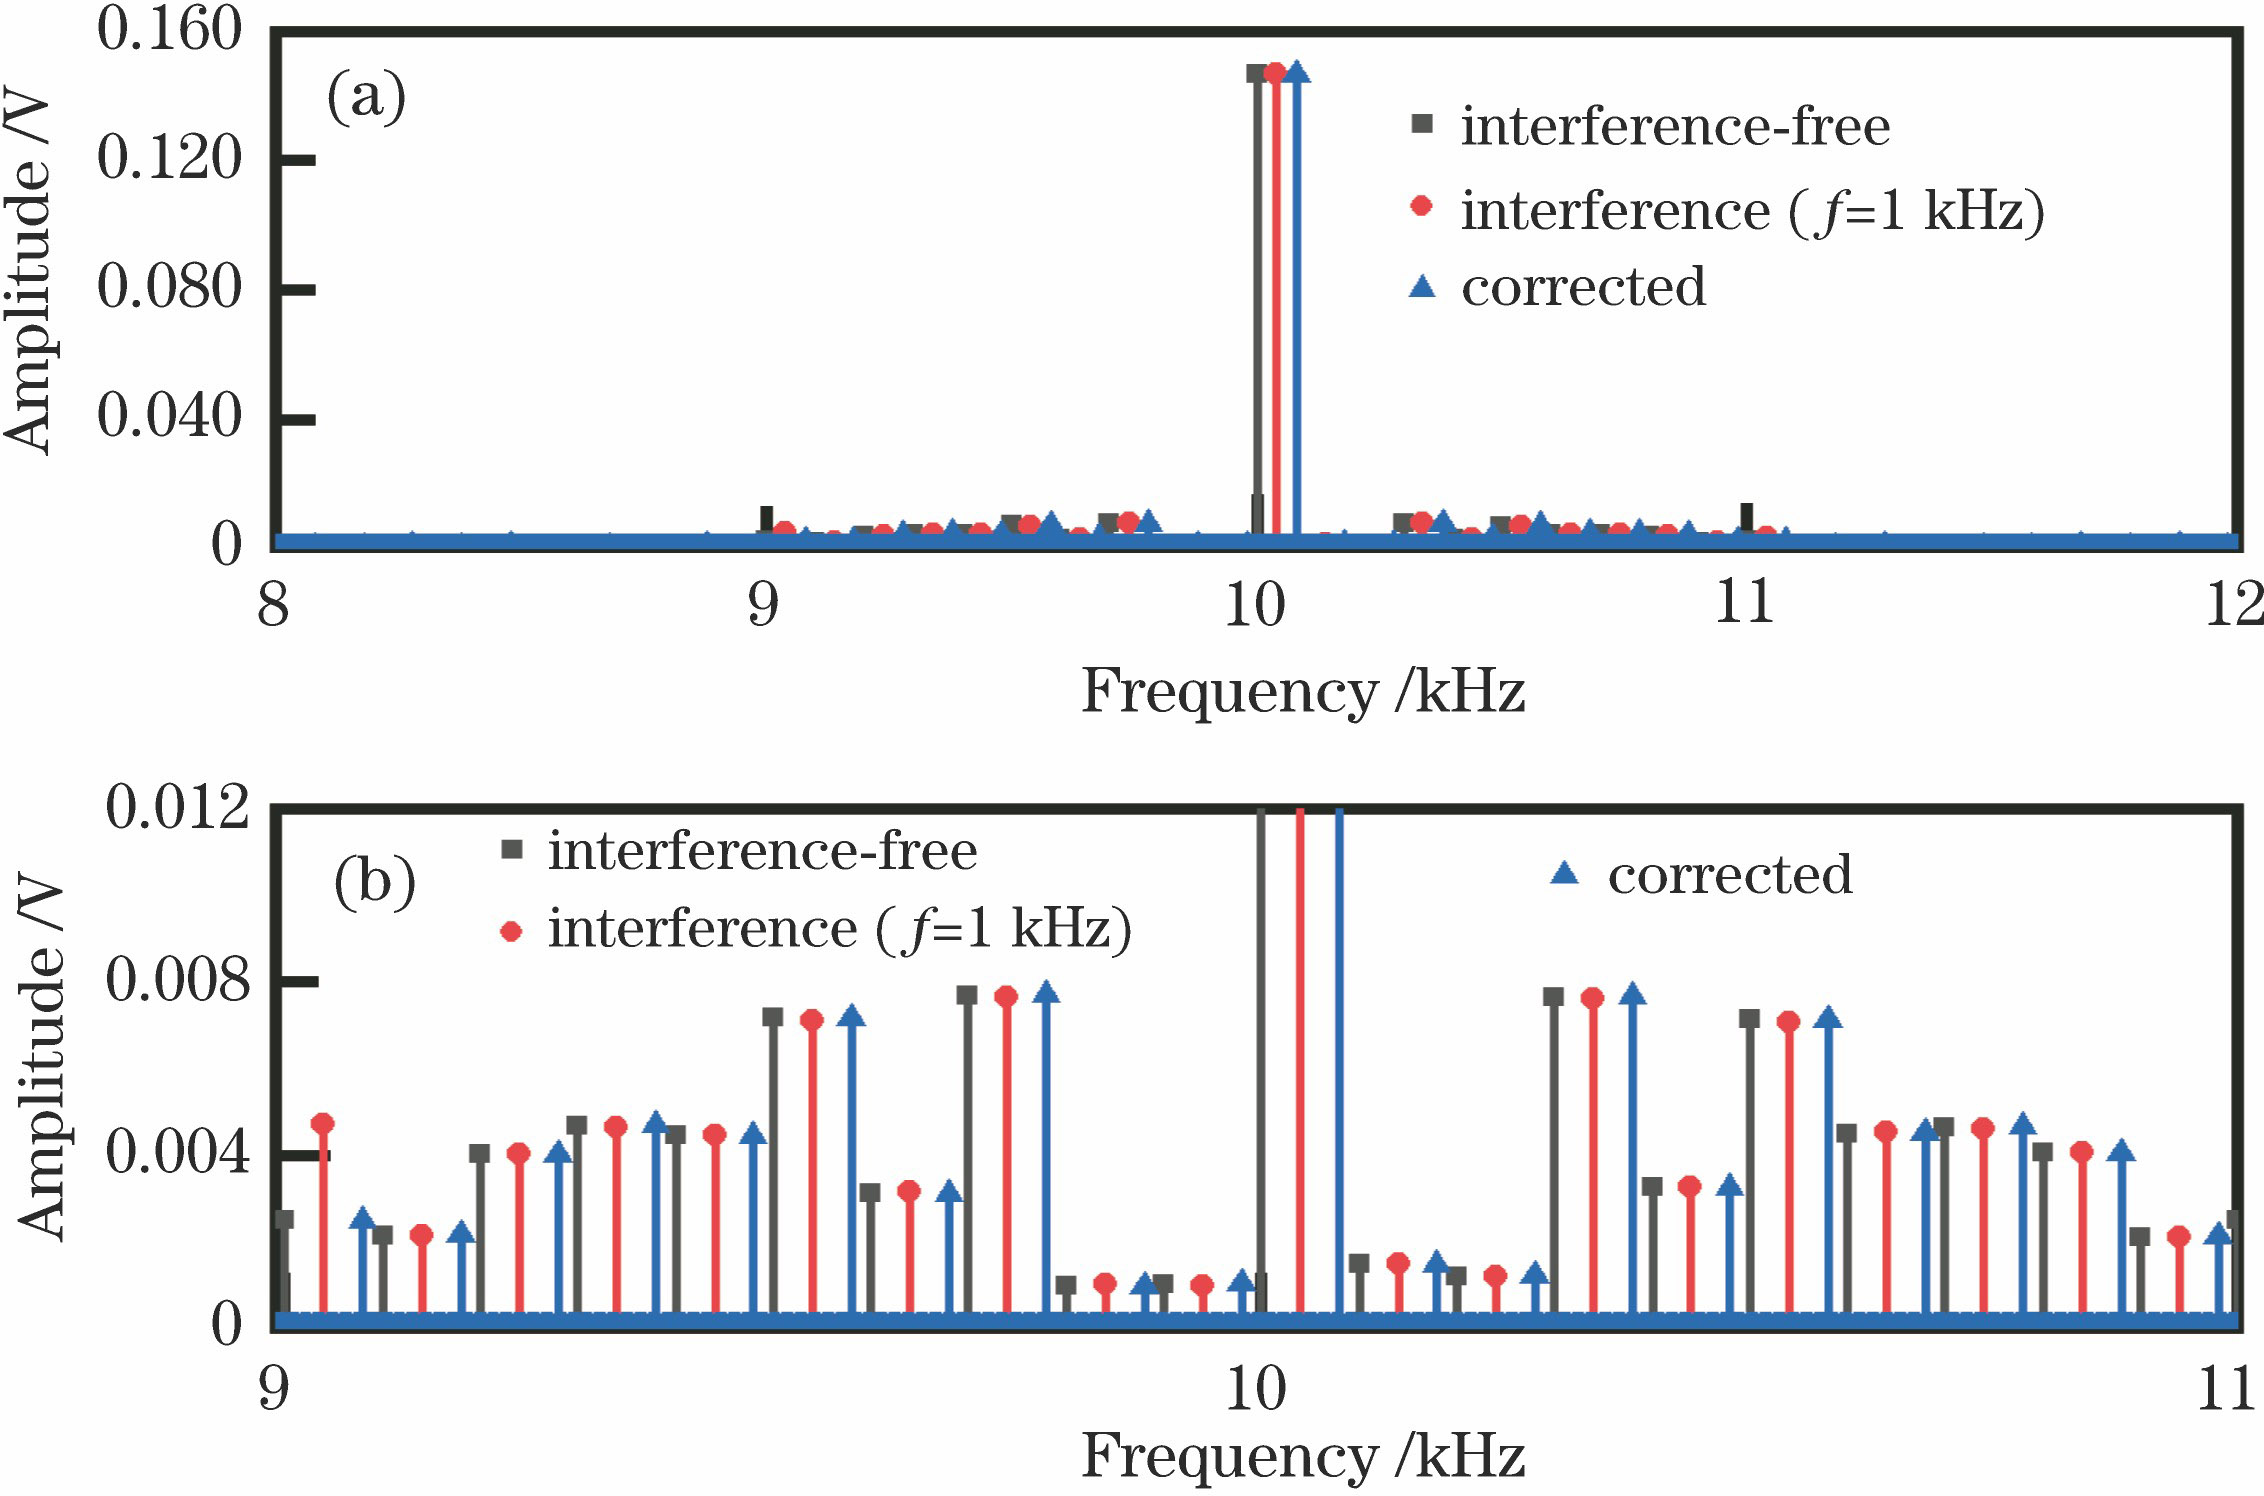
Fig. 2. Spectra of light intensity signal at fundamental frequency (f=1 kHz). (a) Overall view; (b) detailed view
Fig. 3. Spectra of light intensity signal at double-frequency (f=1 kHz)
Fig. 4. Normalized second harmonic signal and residual obtained by simulation (f=1 kHz). (a) 2f/1f signal; (b) residual of 2f/1f signal
Fig. 5. Light intensity signals. (a) Interference-free light intensity signal; (b) interference (f=8 kHz) light intensity signal; (c) corrected light intensity signal
Fig. 6. Spectra of light intensity signal at fundamental frequency (f=8 kHz). (a) Overall view; (b) detailed view
Fig. 7. Spectra of light intensity signal at double-frequency (f=8 kHz)
Fig. 8. Normalized second harmonic signal and residual obtained by simulation (f=8 kHz). (a) 2f/1f signal; (b) residual of 2f/1f signal
Fig. 9. Molar fraction and its error of methane at different interference frequencies
Fig. 10. Simulated molar fraction of methane without correction
Fig. 11. Simulated molar fraction of methane with correction
Fig. 12. Schematic of experimental system
Fig. 13. Interference signal in experimental (f=1 kHz)
Fig. 14. Normalized second harmonic signal and residual obtained by experiment (f=1 kHz). (a) 2f/1f signal; (b) residual of 2f/1f signal
Fig. 15. Interference signal in experiment (f=8 kHz)
Fig. 16. Normalized second harmonic signal and residual obtained by experiment (f=8 kHz). (a) 2f/1f signal; (b) residual of 2f/1f signal
Fig. 17. Measured molar fraction of methane without correction
Fig. 18. Measured molar fraction of methane with correction
|
Table 1. Experimental temperature at different interference frequency ranges

Set citation alerts for the article
Please enter your email address
© Copyright 2018-2021 | Chinese Laser Press. All Rights Reserved 沪ICP备15018463号-20