
Guojun Lu, Hongzhan Liu, "An effective interference suppression algorithm for visible light communication system based on DBSCAN," Chin. Opt. Lett. 18, 011001 (2020)
- Chinese Optics Letters
- Vol. 18, Issue 1, 011001 (2020)
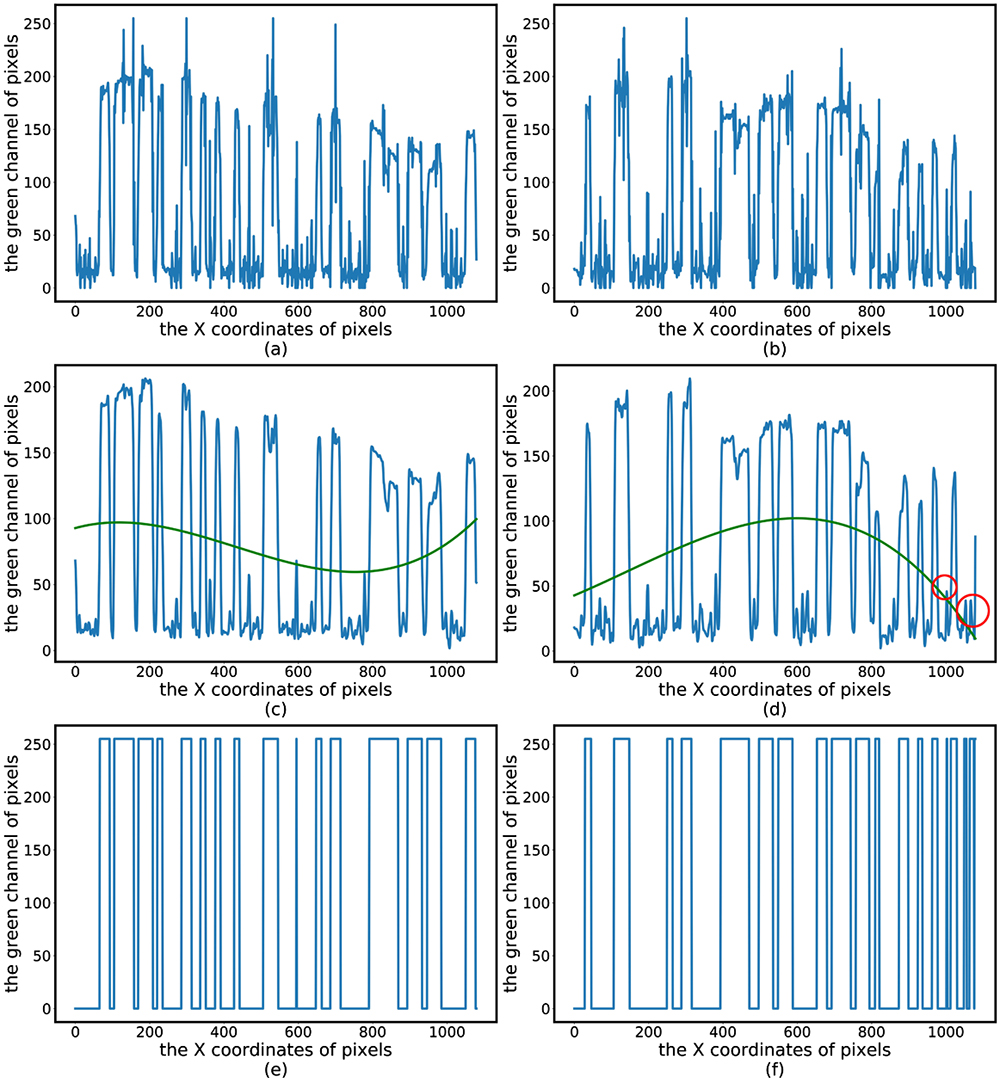
Fig. 1. (a), (b) Green channel distribution of images; (c), (d) green channel distribution of images after low-pass filter and the third-order polynomial fitting (green curve); (e), (f) the judgement through comparing with the threshold.
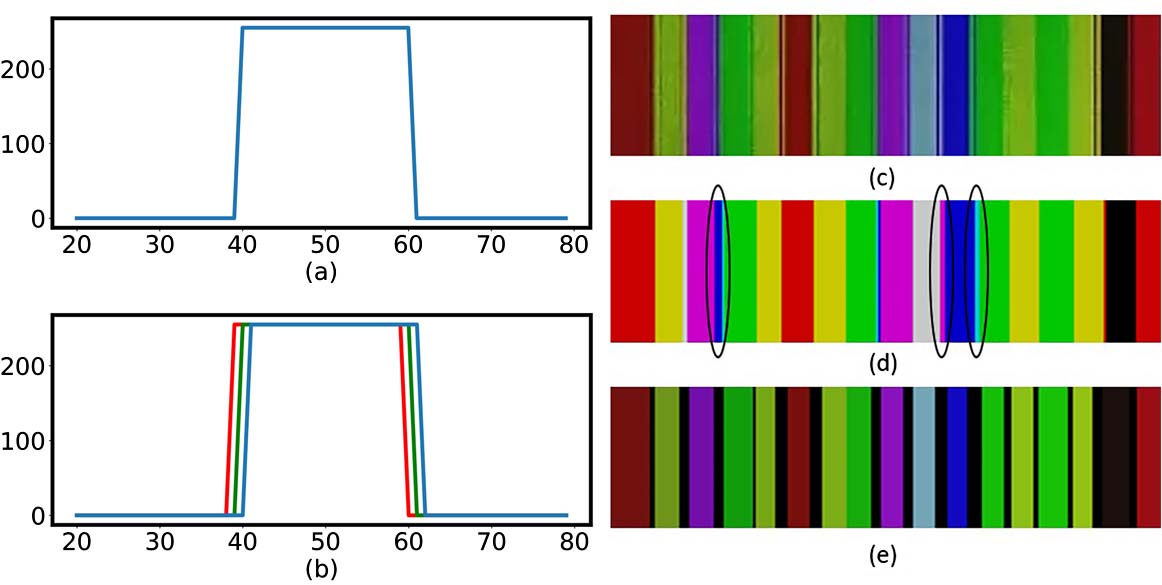
Fig. 2. (a) Ideal edge, (b) real edge, (c) part of the sample image, (d) processed image after judgement, and (e) image processed by the improved algorithm.
Fig. 3. Select a row of pixels in the image.
Fig. 4. Flow chart of improved DBSCAN algorithm.
Fig. 5. Experimental results: (a), (d) unprocessed image; (b), (e) processed and analyzed image; (c), (f) processed image.
Fig. 6. Experimental results: (a), (c) green channel distribution of unprocessed images; (b), (d) green channel distribution of processed images.
Fig. 7. (a), (d), (g) Sample images; (b), (e), (h) details of sample images; (c), (f), (i) images processed by the improved DBSCAN algorithm.
|
Table 1. Color of Binary Sequence
|
Table 2. Modulation Example
| ||||||||||||||||||||||||||||||||||||||||||||||||||||||||||||||
Table 3. Experimental BER (


Set citation alerts for the article
Please enter your email address

© Copyright 2018-2021 | Chinese Laser Press. All Rights Reserved 沪ICP备15018463号-20