Abstract
In order to improve the signal-to-noise ratio and mitigate the damage of noise to the communication quality, an effective interference suppression algorithm, which is based on the improved density-based spatial clustering of applications with noise algorithms, is proposed for visible light communication systems using the complementary metal–oxide–semiconductor image sensor as the receiver. Experimental results show that the algorithm can learn the region where the payload data is located, filter out the noise data, and greatly decrease the interference. The effect of the algorithm is also studied through bit error ratio performance.Visible light communication (VLC) has excellent features such as low cost and absolute safety, as well as large-area support for a light emitting diode (LED), which makes VLC systems hopeful to become an alternative to next-generation wireless communication technologies. Today, many VLC-based products have been proposed, including the wireless communication network light fidelity (Li-Fi) with high security[1], indoor positioning[2], vehicular communications[3], underwater VLC[4], and so on. Most of these products use photodiodes (PDs) as receivers (Rx) to improve the data transmission rate[5,6]. However, some groups believe that mobile phone cameras can also be used as VLC Rx[7–10]. It enables mobile phones to implement a VLC system based on a complementary metal–oxide–semiconductor (CMOS) sensor without adding any external devices, hereinafter referred to as a CMOS-VLC system. With a rolling shutter, the CMOS-VLC system can reach a higher data rate than the image sensors’ frame rate[8]. Although the transmission rate of this scheme is only kilobit per second (kbit/s), it can make the mobile phone satisfy many applications such as positioning LED-identification (LED-ID) recognition, identification of LED traffic lights, and LED optical stripe code recognition[11].
However, in the process of receiving optical signals by using a mobile phone camera, there will be a variety of noises. Especially, at high transmission speeds, the signal-to-noise ratio and communication quality are greatly reduced. Therefore, how to design an effective algorithm to eliminate the interference in the images becomes important.
In the problem of denoising and decoding, many methods[8,10,12,13] have been proposed. Most of them used a filter to denoise and set thresholds for decoding. This method can effectively remove high-frequency interference in the case of low bandwidth, but when the bandwidth becomes larger, a filter will make a loss. However, many solutions based on machine learning have recently been used in VLC. Li et al.[14] used a support vector machine (SVM) and artificial neural networks (ANNs) to help improve the LED-ID recognition rate and its performance. Hao et al.[15] utilized an end-to-end learning network to improve the VLC system performance. Also, Lu et al.[16,17] utilized the density-based spatial clustering of applications with noise (DBSCAN) algorithm in VLC systems, and the algorithm solved the amplitude jitter problem occurring during transmission and successfully improved the system performance. The machine learning adaptive algorithm can solve many problems in modulation format recognition and optical transmission equalization demodulation. Through the study of machine learning, we designed an effective interference suppression algorithm based on the improved DBSCAN algorithm, which can effectively solve the interference problem of the CMOS-VLC system.
In the CMOS-VLC system, the signal generator is generally divided into two types: the white LED transmitter (Tx) and the red–green–blue LED (RGB-LED) Tx. In this Letter, we focus on the latter.
Many papers[8,10,12,13] used different filters to sharpen and denoise the image according to different situations. Then, a second or third-order polynomial fitting is applied for setting the threshold. The threshold is to distinguish logic 1 and 0.
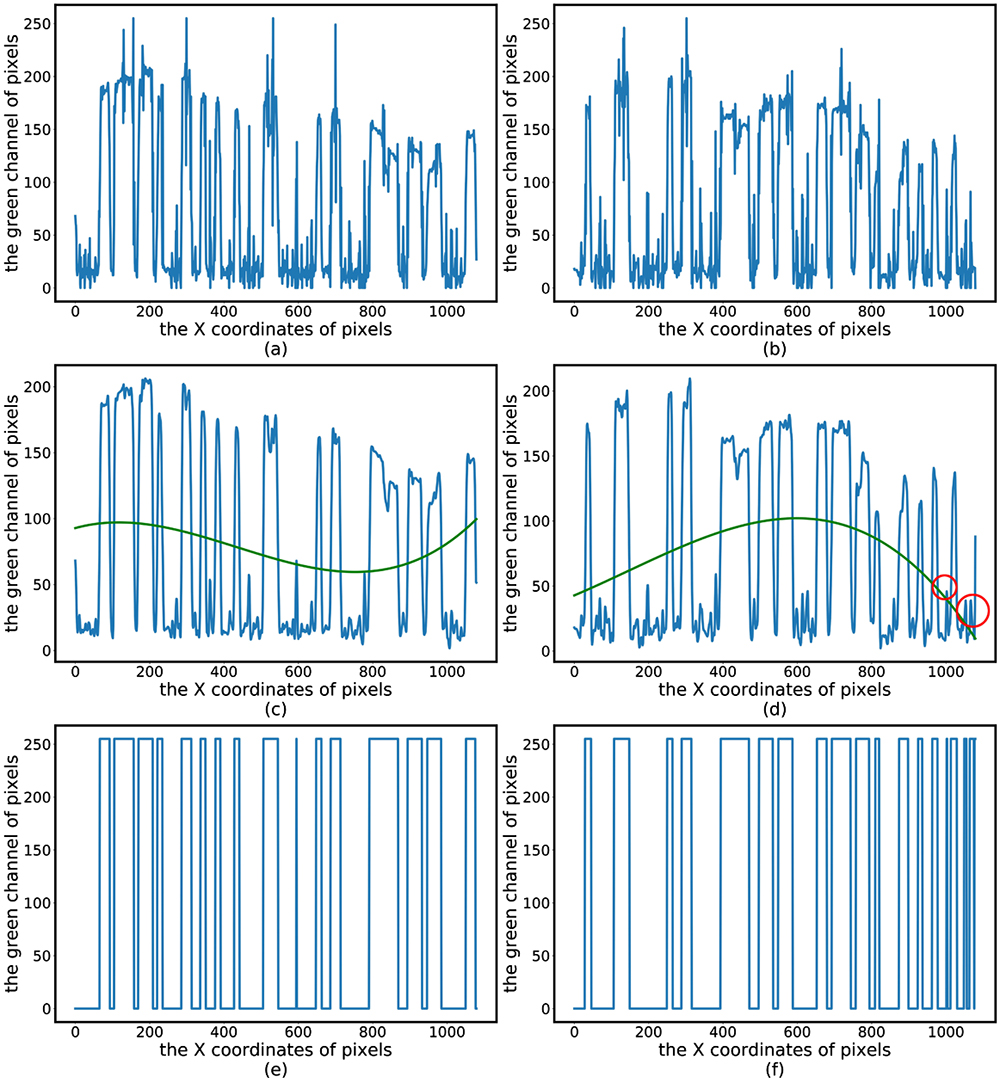
Figure 1 shows the details of this method. Figure 1(a) shows the green channel distribution of one image. Figure 1(c) shows the distribution after a low-pass filter and the third-order polynomial fitting (green curve). As shown in Fig. 1(e), every value that is above the threshold is considered as “1” (set as 255 in the figure), whereas every value below the threshold is considered as “0” (set as 0 in the figure). The method works well in most of the images. However, in some pictures, the method will cause some error, as shown in Figs. 1(b), 1(d), and 1(f). Figure 1(b) shows the green channel distribution of the image. Figure 1(d) shows the green channel distribution of one image after a low-pass filter and the third-order polynomial fitting (green curve). But, in the process of setting the threshold, due to the unreasonable fitting curve at the end of the data, some data in the red circle part that was originally considered as “0” will be considered as “1”. The reason for this error is that the fitting curve is defined according to the entire data, and the error may occur when the value distribution is uneven.

Figure 1.(a), (b) Green channel distribution of images; (c), (d) green channel distribution of images after low-pass filter and the third-order polynomial fitting (green curve); (e), (f) the judgement through comparing with the threshold.
At the same time, this method will make some noise in the image. In the ideal case, the edges of three color channels of an optical signal should be coincident, as shown in Fig. 2(a). However, since this method does not combine the values of the three color channels and processes them at the same time, the edges of different color channels will be different, as shown in Fig. 2(b). Figure 2(c) shows part of the image, and Fig. 2(d) shows part of the processed image after this method. Some interference in the red circle part will be generated between the stripes. The reason for the error is that this method will deal with the data of three color channels separately. However, the improved DBSCAN algorithm uses local data for analysis and will deal with the data of three color channels at the same time. Figure 2(e) shows the processed image after the improved algorithm, and its interference of the edge has been reduced compared with Fig. 2(d).
Figure 2.(a) Ideal edge, (b) real edge, (c) part of the sample image, (d) processed image after judgement, and (e) image processed by the improved algorithm.
The DBSCAN algorithm is a relatively common unsupervised machine learning algorithm. It can automatically find clusters of arbitrary shape and can effectively find noise points and outliers, which make it become an excellent and efficient data clustering algorithm[18]. At the same time, the DBSCAN algorithm requires two parameters: neighborhood radius (Eps) and minimum points in the Eps neighborhood (MinPts)[18]. The former determines the maximum radius of the data point in the search for similar data points, and the latter determines the minimum number of data points that a cluster is not considered as noise. These two parameters generally require artificial settings, but some studies have proposed that the algorithm can adaptively find Eps and MinPts[19,20]. Since the payload data in the samples obtained in the CMOS-VLC system is far more than the noise data, it is very suitable to use the DBSCAN algorithm for interference reduction processing. The DBSCAN algorithm clustered elements by distance between them, but the relationship between pixels in the sample images is more than just distance, so this Letter designed an effective algorithm based on the traditional DBSCAN algorithm for a CMOS-VLC system.
In the images obtained by the CMOS-VLC system, in addition to the area occupied by the RGB-LED (the area enclosed by the white circle in the Fig. 3), each row of pixels carries the same message. In order to reduce the operation time of the algorithm, we select a valid region from the image, as shown in Fig. 3.
Figure 3.Select a row of pixels in the image.
The images’ resolution is 1920 × 1080, and the width is 1080. Most of the DBSCAN algorithm will be applied to two-dimensional (2D) datasets, and the relationship between points in the 2D datasets is only distance. However, in the image obtained by the CMOS-VLC system, the relationship among pixels contains more than distance such as color. In order to determine whether two pixels (represented by pixel 1 and pixel 2 below) belong to the same stripe, this Letter proposes a parameter , which is determined by the color channel values of pixel 1 and 2 and the threshold : where is the red value of pixel 1, is the red value of pixel 2, is the green value of pixel 1, is the green value of pixel 2, is the blue value of pixel 1, and is the blue value of pixel 2.
The threshold needs to be set in advance according to the overall brightness of the sample, generally set to 20–30. When , the difference between two pixels is too large, and the two pixels belong to different stripes. When , the two pixels are considered to be the same type of pixels. To facilitate understanding of the idea, Fig. 4 shows the flow chart of the improved DBSCAN algorithm.
Figure 4.Flow chart of improved DBSCAN algorithm.
In the experiment, we use RGB-LED as the Tx and on–off keying (OOK) as the three-color modulation scheme. The implementation method is taking consecutive three bits of the binary sequence, and the binary sequence is used to control the on–off state of the RGB-LED, which can make the RGB-LED realize the modulation of eight colors. Implementation methods and examples can be seen in Tables 1 and 2 in detail. We set up the random binary sequence in advance and load it onto RGB-LED using the microcontroller unit (HC8600EM3V2.0-STC89c52). We make the optical signals send and times in a second. The information carried by an optical signal is 3 bits, so the transmission rate is set to and , respectively. We use a mobile phone (G9500, made by Samsung China) rear camera to record the optical signals. The experiment was carried out with a short transmission distance, and the surface of the RGB-LED to CMOS image sensor was about 2 cm. The transmission distance can also be increased by increasing the number and power of LEDs. Video parameters have a frame rate of 60 frames/s, and the resolution is . Then, we use the algorithm to analyze the video frames extracted by Python. Figure 5(a) shows the sample image obtained at the transmission rate of . The interference is not very obvious. In order to visualize the effect of the algorithm, in Fig. 5(b), the clusters of valid stripes are represented by black and white stripes in turn, and the interference stripes are represented by red stripes. Figure 5(c) sets the color of the cluster of valid stripes to the color mean of the cluster, and the color of the cluster of noise stripes to black. It can be seen that after processing, the algorithm adaptively can find the clusters of valid stripes and the clusters of noise without discarding the original information after processing.
| 1st/B | 2nd/G | 3rd/R | Color |
|---|
| 0 | 0 | 0 | Black |
| 0 | 0 | 1 | Red |
| 0 | 1 | 0 | Green |
| 0 | 1 | 1 | Yellow |
| 1 | 0 | 0 | Blue |
| 1 | 0 | 1 | Purple |
| 1 | 1 | 0 | Blue–green |
| 1 | 1 | 1 | White |
Table 1. Color of Binary Sequence
| Binary Sequence Sample | Output Sample |
|---|
| 000001010011 | Black red green yellow |
Table 2. Modulation Example
Figure 5.Experimental results: (a), (d) unprocessed image; (b), (e) processed and analyzed image; (c), (f) processed image.
When the transmission rate is , the effect of the algorithm is more obvious than that of the transmission rate at . Figure 5(d) shows the images obtained at . The interference of noise makes it impossible to obtain the width and overall color of the stripes well. Figures 5(e) and 5(f) are used to visualize the effect of the algorithm. As shown in Fig. 5(e), clusters of valid stripes are represented by black and white stripes in turn, and noise stripes are represented by red stripes. Figure 5(f) sets the color of the cluster of valid stripes to the color mean of the cluster, and the color of the cluster of noise stripes to black. It can be seen that after the improved DBSCAN algorithm, the stripes become clear, and most of the interference signal has been removed. At the same time, the information carried by the cluster is consistent with the original images.
We took the value of the green channel of two original images and analyzed it. As shown in Figs. 6(a) and 6(c), the image carries many high-frequency noise signals. However, after processing by the improved DBSCAN algorithm, as shown in Figs. 6(b) and 6(d), it can be seen that most of the noise signals of the image have been filtered out.
Figure 6.Experimental results: (a), (c) green channel distribution of unprocessed images; (b), (d) green channel distribution of processed images.
At present, almost all CMOS image sensors carry the Bayer filter[21], which will cause the zipper effect[21] when the color of pixels changes so quickly, as shown in Figs. 7(a) and 7(b). Then, due to the rolling shutter effect, exposure overlapping will occur between optical signals when they are crowded, as shown in Figs. 7(d) and 7(e). Last, the Tx needs to control three LEDs at the same time, but some weak Tx cannot send the signals to LEDs at once, resulting in some delays in the optical signals, as shown in Figs. 7(g) and 7(h). For these three kinds of interference, Figs. 7(c), 7(f), and 7(i) show the clustering results after the improved algorithm. As shown in Fig. 7(c), there are some black stripes in the middle of the payload data, and it is because the algorithm considers some pixels in a data as noise and sets its color as black. In spite of it, the payload data still can be put into a cluster and decoded successfully. Figures 7(f) and 7(i) show that the algorithm can remove the interference at the edge of stripes successfully.
Figure 7.(a), (d), (g) Sample images; (b), (e), (h) details of sample images; (c), (f), (i) images processed by the improved DBSCAN algorithm.
The improved DBSCAN algorithm needs to define the parameters Eps and MinPts at first. However, the effect of clustering has a close relationship with the parameters. In order to know what the relationship is, we use the bit error ratio (BER) to evaluate the performance with different parameters. The received samples are clustered using the improved DBSCAN algorithm and decoded according to the width and mean color of each cluster. Then, the result is compared with the original binary sequence to get the BER.
Table 3 shows the CMOS-VLC system experimental BER versus different Eps and MinPts at the transmission rate of . In the algorithm, the Eps is the neighborhood radius of a given pixel. It can be found that a too large or too small Eps will cause high BER performance. If a small Eps is set, payload data is possible to be divided into two or more clusters with some noise occuring in the middle of the payload data. In contrast, if the Eps is too large, some very close noises will be added into the same cluster and considered as payload data. In the algorithm, the MinPts is the minimum points in the Eps neighborhood area. It can be found that the value of MinPts that is too large or too small will cause high BER performance too. That is because if the MinPts is set too small, some noise that fills a lot of pixels will be judged as payload data and the algorithm will find lots of clusters. In contrast, if MinPts is set too large, the payload data that contain a small number of pixels will be judged as noise. Both of these will lead to a bad BER performance.
| Eps | MinPts |
|---|
| 2 | 3 | 4 | 5 | 6 | 7 |
|---|
| 4 | 3.58 | 3.58 | 2.39 | 1.00 | 4.42 | 32.76 |
| 5 | 3.39 | 3.39 | 2.59 | 0.60 | 2.81 | 21.10 |
| 6 | 3.39 | 3.39 | 2.59 | 0.80 | 2.60 | 17.97 |
| 7 | 3.39 | 3.39 | 2.59 | 0.60 | 2.40 | 16.72 |
| 8 | 3.78 | 3.78 | 2.59 | 0.60 | 2.20 | 16.51 |
| 10 | 6.95 | 6.16 | 3.98 | 0.60 | 2.20 | 16.51 |
| 12 | 9.53 | 8.53 | 4.18 | 0.80 | 2.20 | 16.51 |
Table 3. Experimental BER () versus Different Eps and MinPts
As a result, the minimum BER is , when the optimum MinPts is 5, and Eps is 5, 7, 8, and 10, respectively. Due to the rolling shutter of the CMOS sensor, the width of the stripe is mainly affected by the transmission rate[7]. The DBSCAN algorithm is based on the density of the dataset, that is, the effect of the algorithm will not decrease when the widths of stripes remain with few changes. The optimum parameters can be used at the same transmission rate but in different distances. We set the Eps as 7 and MinPts as 5, then reset the binary sequence, and record the optical signals again after setting the new parameters. After setting the new parameters, BER is remeasured as . We use the same method to determine the parameters at the transmission rate of , , and . Then, we remeasure the BER. When the transmission rate is below , no error is observed. But, the BER increases to at the transmission rate of . It is because when the transmission rate increases, the area of valid data is the same as that of the noise data, and the improved DBSCAN algorithm cannot distinguish noise from payload data. Also, we use BER to evaluate the performance of setting the threshold at the transmission rate of . Due to the disadvantage mentioned at the beginning of the Letter, the BER of this method is . Therefore, the algorithm is considered to perform well at a transmission rate below .
In this Letter, we design an algorithm based on the DBSCAN algorithm in order to reduce the interference in the system. As far as we know, it is the first time that the DBSCAN algorithm has been successfully applied to the CMOS-VLC system. The experimental results show that the algorithm can greatly reduce the interference and perform well at transmission rate below . There are many other factors that may affect the algorithm and the selection of the optimal parameters. In the future, we will continue to optimize the algorithm to make it more adaptive to complex environments. All in all, our proposed scheme shows great potential for the CMOS-VLC system, and the system can be more effective by using the algorithm we designed.
References
[1] H. Haas, L. Yin, Y. L. Wang, C. Chen. J. Lightwave Tech., 34, 1533(2016).
[2] H. S. Kim, D. R. Kim, S. H. Yang, Y. H. Son, S. K. Han. J. Lightwave Tech., 31, 134(2013).
[3] M. Uysal, Z. Ghassemlooy, A. Bekkali, A. Kadri, H. Menouar. IEEE Veh. Tech. Mag., 10, 45(2015).
[4] N. Chi, M. Shi. Chin. Opt. Lett., 16, 120603(2018).
[5] J. Xu, M. Jiang, Y. Chen. Chin. Opt. Lett., 17, 070201(2019).
[6] L. Qiao, X. Lu, S. Liang, J. Zhang, N. Chi. Chin. Opt. Lett., 16, 060604(2018).
[7] C. Danakis, M. Afgani, G. Povey, I. Underwood, H. Haas. 2012 IEEE Globecom Workshops, 1244(2012).
[8] C. W. Chow, C. Y. Chen, S. H. Chen. Opt. Express, 23, 26080(2015).
[9] Y. Liu, H. Y. Chen, K. Liang, C. W. Hsu, C. W. Chow, C. H. Yeh. IEEE Photon. J., 8, 7800107(2016).
[10] C. W. Chow, C. Y. Chen, S. H. Chen. IEEE Photon. J., 7, 7903607(2015).
[11] H. Zhang, Y. J. Li, W. P. Guan, J. Y. Li, J. H. Zheng, X. J. Zhang. Signal Process-Image, 75, 128(2019).
[12] Z. Z. Li, Z. S. Zhang, Q. Z. Yuan, Y. J. Qiao, K. Liao, H. H. Yu. IEEE International Conference on Network Infrastructure and Digital Content (IC-NIDC), 239(2016).
[13] W. C. Wang, C. W. Chow, L. Y. Wei, Y. Liu, C. H. Yeh. Opt. Express, 25, 10103(2017).
[14] J. Y. Li, W. P. Guan. Appl. Sci., 8, 2425(2018).
[15] L. L. Hao, D. Y. Wang, W. Y. Cheng, J. Li, A. F. Ma. Opt. Commun., 442, 110(2019).
[16] X. Y. Lu, Y. J. Zhou, L. Qiao, W. X. Yu, S. Y. Liang, M. M. Zhao, Y. H. Zhao, C. Lu, N. Chi. Phys. Scripta, 94, 055506(2019).
[17] X. Y. Lu, L. Qiao, Y. J. Zhou, W. X. Yu, N. Chi. Opt. Commun., 430, 299(2019).
[18] M. Ester, H. P. Kriegel, J. Sander, X. Xiaowei. Second International Conference on Knowledge Discovery and Data Mining, 226(1996).
[19] B. L. Xu, F. R. Shen, J. X. Zhao. Neural Networks, 110, 141(2019).
[20] E. Rosalina, F. D. Salim, T. Sellis. 2017 IEEE Conference on Computer Communications Workshops, 295(2017).
[21] G. Zapryanov, I. Nikolova. International Scientific Conference on Computer Science, 133(2008).