
He Qiaoying, Huang Linhai. Imaging Technology Based on Single-Point Laser Scanning[J]. Laser & Optoelectronics Progress, 2021, 58(6): 628002
- Laser & Optoelectronics Progress
- Vol. 58, Issue 6, 628002 (2021)
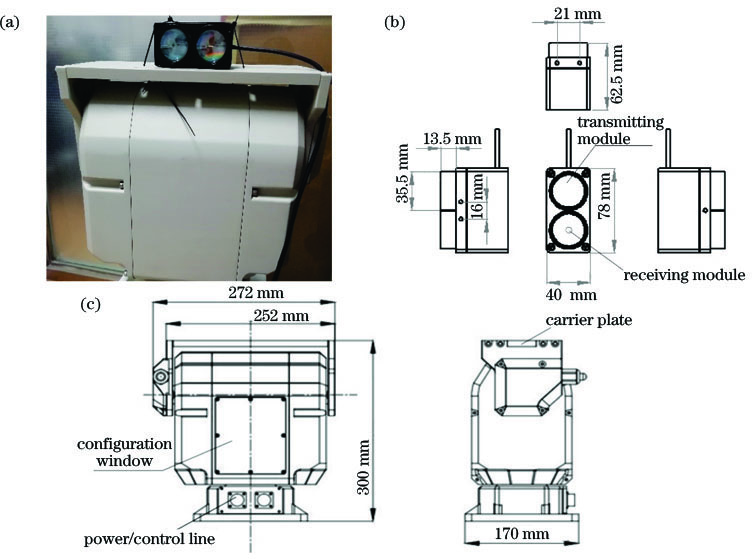
Fig. 1. Experimental platform. (a) Physical image; (b) size of the laser rangefinder; (c) size of the pan-tilt
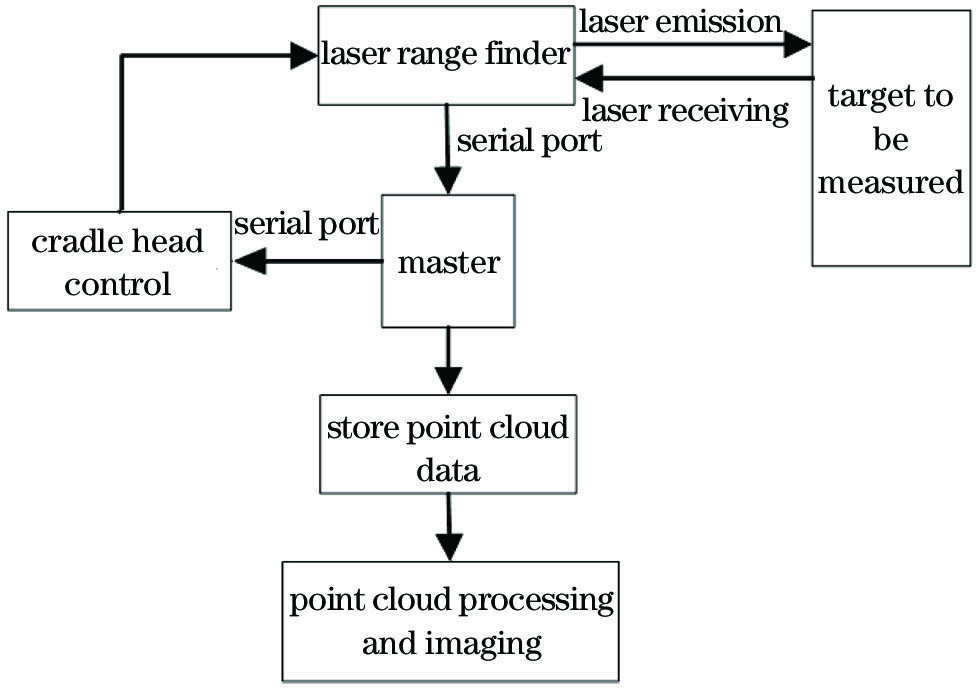
Fig. 2. Framework of our system
Fig. 3. 3D point cloud obtained by our system
Fig. 4. Variance of 760 sets of data
Fig. 5. Flow chart of our algorithm
Fig. 6. Experimental data. (a) Planar imaging scene; (b) planar imaging point cloud; (c) angular imaging scene; (d) angular imaging point cloud; (e) early experiment scene; (f) unprocessed point cloud
Fig. 7. Outdoor imaging scene
Fig. 8. Outdoor imaging result
Fig. 9. Schematic diagram of the interval between two adjacent points
Fig. 10. Fitting graph of straight. (a) Straight line1; (b) straight line2
|
Table 1. Distance measurement error unit:cm
| ||||||||||||||
Table 2. Size measurement error of the object unit:cm
|
Table 3. Angle fitting error unit: (°)
|
Table 4. Accuracy at the beginning of the experiment and after treatment unit:%

Set citation alerts for the article
Please enter your email address
© Copyright 2018-2021 | Chinese Laser Press. All Rights Reserved 沪ICP备15018463号-20