• Journal of Infrared and Millimeter Waves
  • Vol. 39, Issue 2, 242 (2020)
Sai LI1、2、3, Yong HU1、2、*, Cai-Lan GONG1、2, and Wen-Tao SONG1、2、3
Author Affiliations
  • 1Shanghai Institute of Technical Physics, Chinese Academy of Sciences, Shanghai200083, China
  • 2CAS Key Laboratory of Infrared System Detection and Imaging Technology, Shanghai Institute of Technical Physics,Shanghai00083,China
  • 3University of Chinese Academy of Sciences,Beijing100049,China
  • show less
    DOI: 10.11972/j.issn.1001-9014.2020.02.012 Cite this Article
    Sai LI, Yong HU, Cai-Lan GONG, Wen-Tao SONG. A step-by-step geometric correction and error analysis of swing-swept array thermal infrared aerial image[J]. Journal of Infrared and Millimeter Waves, 2020, 39(2): 242 Copy Citation Text show less
    Schematic diagram of the optical structure system
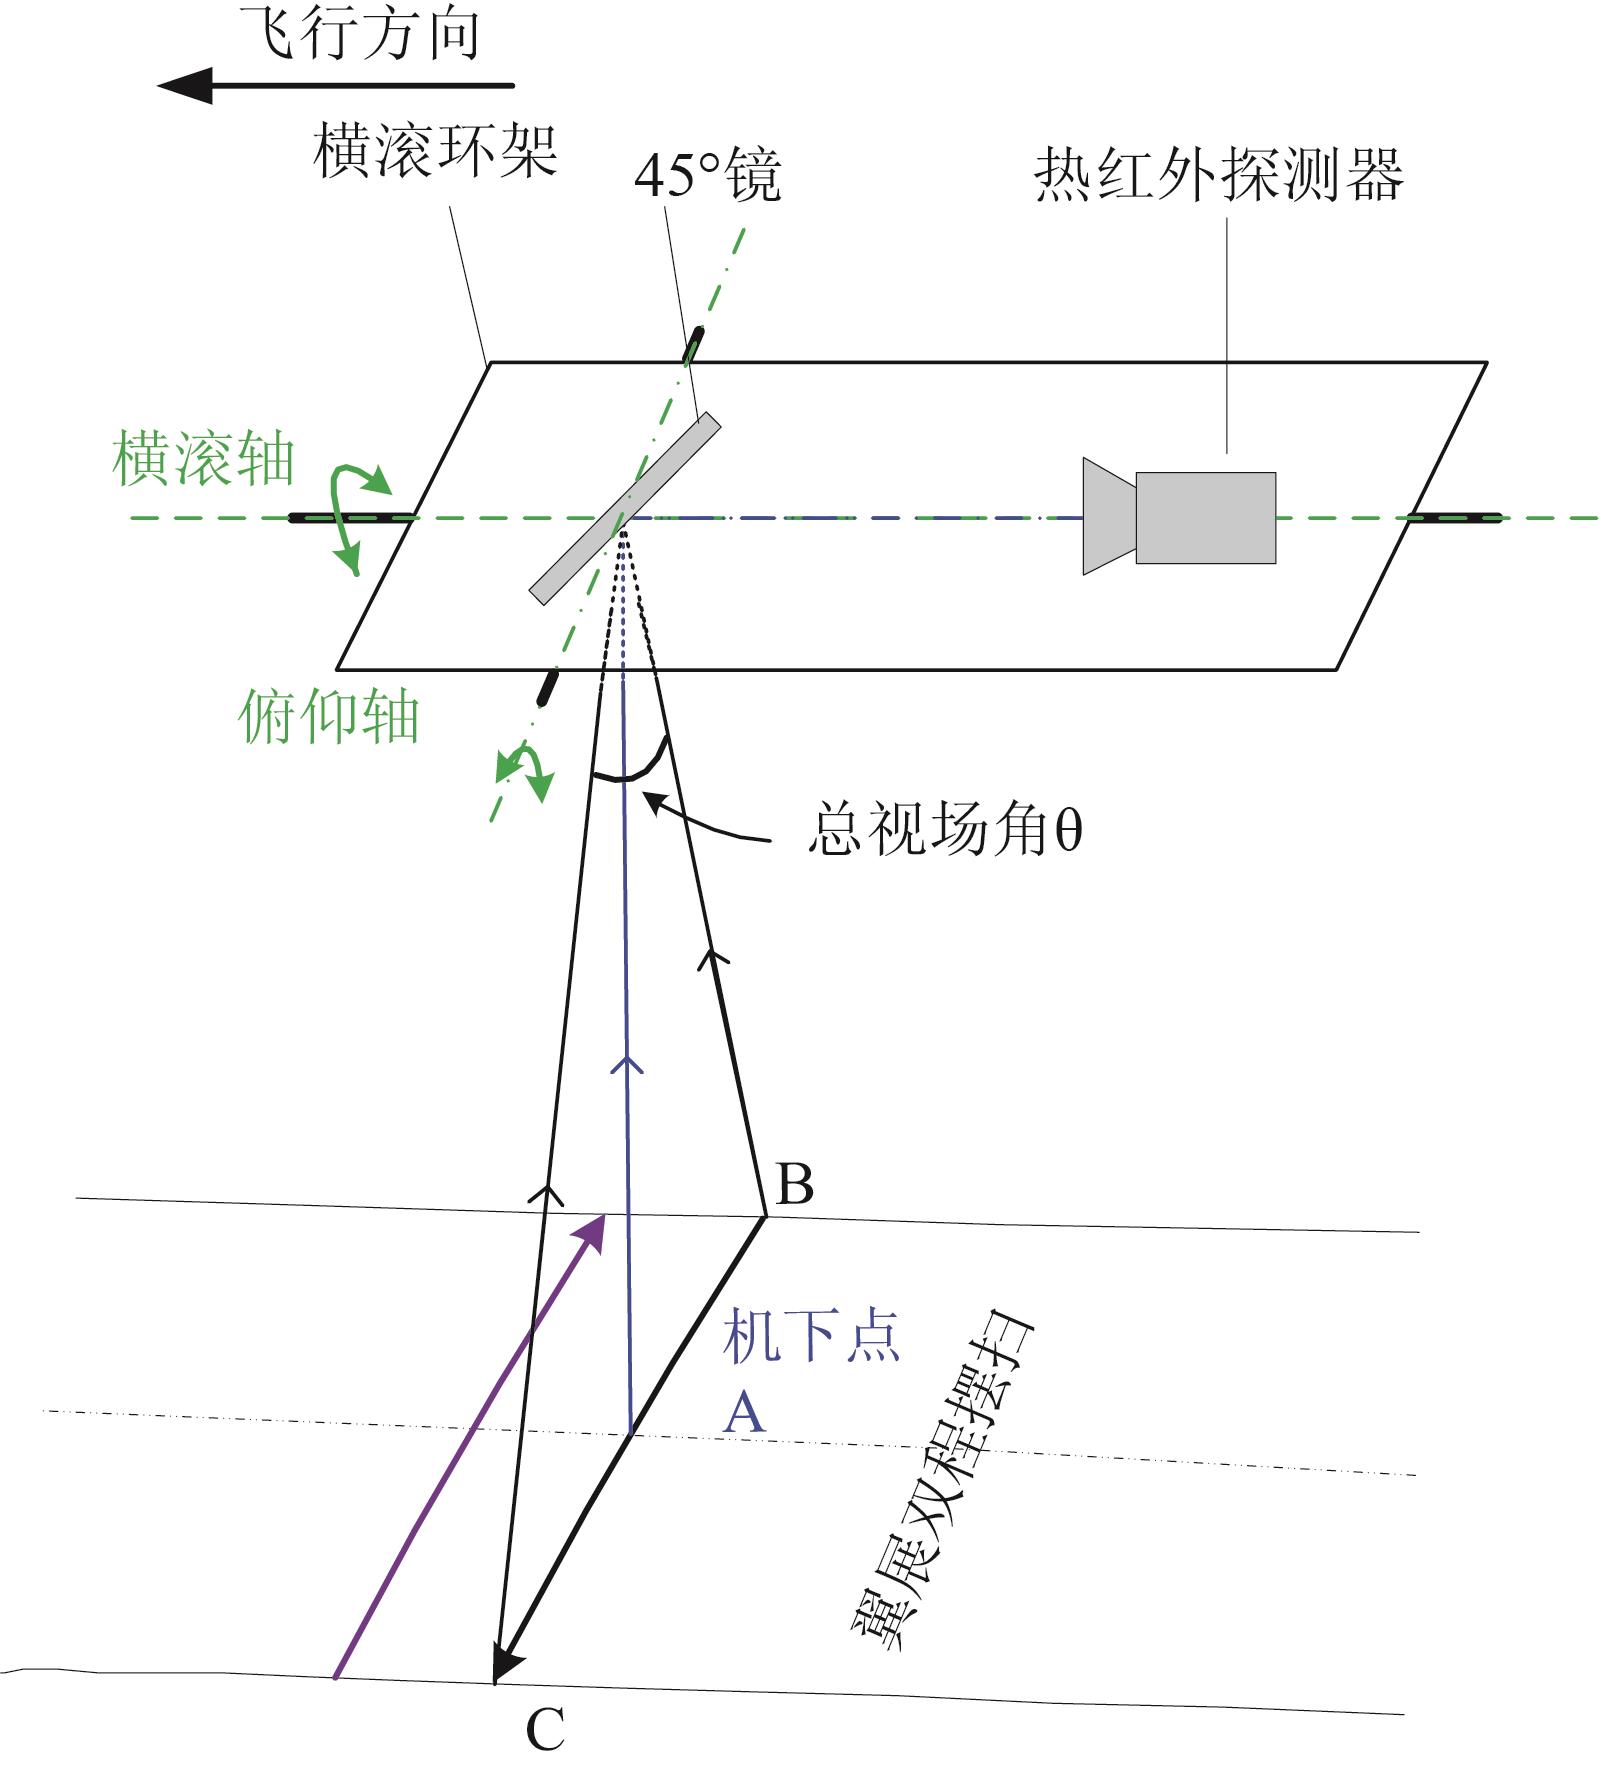
    Fig. 1. Schematic diagram of the optical structure system
    UAV bi-directional whiskbroom scanning system
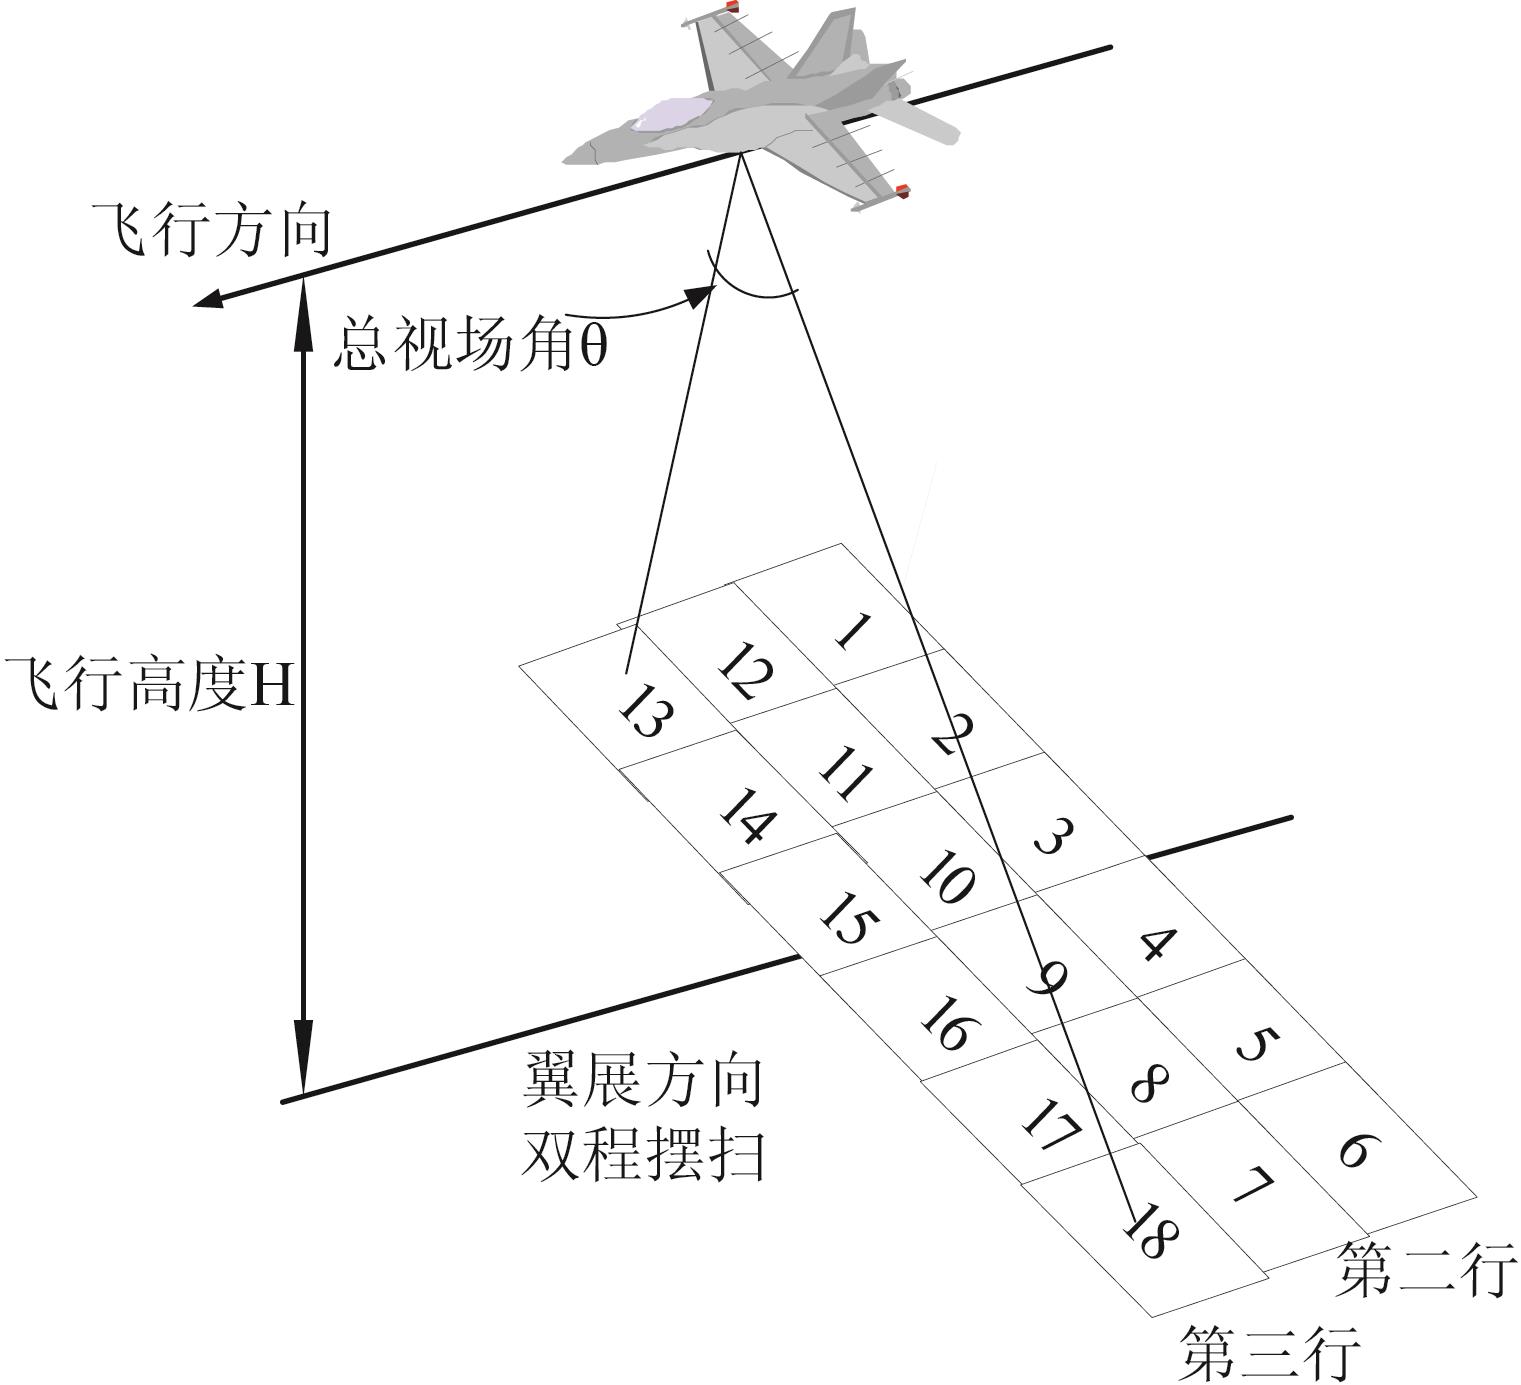
    Fig. 2. UAV bi-directional whiskbroom scanning system
    Wingspan direction point spatial resolution in -30°whiskbroom scanning
    Fig. 3. Wingspan direction point spatial resolution in -30°whiskbroom scanning
    Positioning simulation results of six angles
    Fig. 4. Positioning simulation results of six angles
    Simulation results of positioning error from 0 to 90 degrees (a) latitude orientation error, (b) longitude orientation error
    Fig. 5. Simulation results of positioning error from 0 to 90 degrees (a) latitude orientation error, (b) longitude orientation error
    Visual vector rigorous image correction model
    Fig. 6. Visual vector rigorous image correction model
    No control point geometric correction process
    Fig. 7. No control point geometric correction process
    Extraction of virtual control points
    Fig. 8. Extraction of virtual control points
    Diagram of positioning error results
    Fig. 9. Diagram of positioning error results
    Geometric correction results of visual vector method
    Fig. 10. Geometric correction results of visual vector method
    Infrared mosaic and temperature inversion diagram (a) the result of the study area after Mosaic, (b) correction result after Mosaic,(c) map to Google earth result,(d) infrared temperature inversion diagram
    Fig. 11. Infrared mosaic and temperature inversion diagram (a) the result of the study area after Mosaic, (b) correction result after Mosaic,(c) map to Google earth result,(d) infrared temperature inversion diagram
    The 8 control points in the result image and Google earth
    Fig. 12. The 8 control points in the result image and Google earth
    Comparison of distance relative errors of control point pairs
    Fig. 13. Comparison of distance relative errors of control point pairs
    Comparison of angular relative errors of control point pairs
    Fig. 14. Comparison of angular relative errors of control point pairs
    Relative errors of different swing-angle pairs
    Fig. 15. Relative errors of different swing-angle pairs
    序号项目参数
    1焦距41 mm
    2角分辨率0.4 mrad
    3面阵规模640×480
    4摆扫一行拍摄张数6
    Table 1. whiskbroom scanning thermal infrared camera parameters
    误差变量标准差
    经度/(°)0.00001
    纬度/(°)0.00001
    高度/m1
    横滚角/(°)0.001
    俯仰角/(°)0.001
    偏航角/(°)0.001
    IMU与传感器坐标轴误差/(°)0.0001
    Table 2. POS simulation experimental data
    角度/(°)

    经度实测值

    /(°)

    经度标准差

    /(°)

    纬度实测值

    /(°)

    纬度标准差

    /(°)

    综合标准差/m
    30120.9593440.00009130.5453020.00009214.23
    18120.9592550.00006830.5450110.00007110.81
    6120.9591770.00003330.5450110.0000425.87
    -6120.9591110.00003730.5444330.0000456.41
    -18120.9590330.00007230.5441440.00007711.59
    -30120.9589660.00008830.5439020.00009314.08
    Table 3. Comparison of errors of six swing sweeps
    摆扫角度/(°)经度方向中误差/m纬度方向中误差/m联合中误差/m
    29.59578.249.8912.873
    17.79256.847.3610.048
    5.93795.926.218.580
    -5.94606.246.829.244
    -17.77987.968.0911.349
    -29.59618.178.7411.964
    -29.64228.4110.0913.135
    -17.78758.048.1311.433
    -5.90587.758.5211.517
    5.94146.827.8110.368
    17.75098.138.8312.003
    29.61498.338.8612.161
    平均7.5718.28011.223
    Table 4. positioning error results of swing scan images
    Sai LI, Yong HU, Cai-Lan GONG, Wen-Tao SONG. A step-by-step geometric correction and error analysis of swing-swept array thermal infrared aerial image[J]. Journal of Infrared and Millimeter Waves, 2020, 39(2): 242
    Download Citation