Author Affiliations
Key Laboratory of Advanced Technologies of Materials, Ministry of Education, School of Materials Science and Engineering, Southwest Jiaotong University, Chengdu 610031, Sichuan, Chinashow less
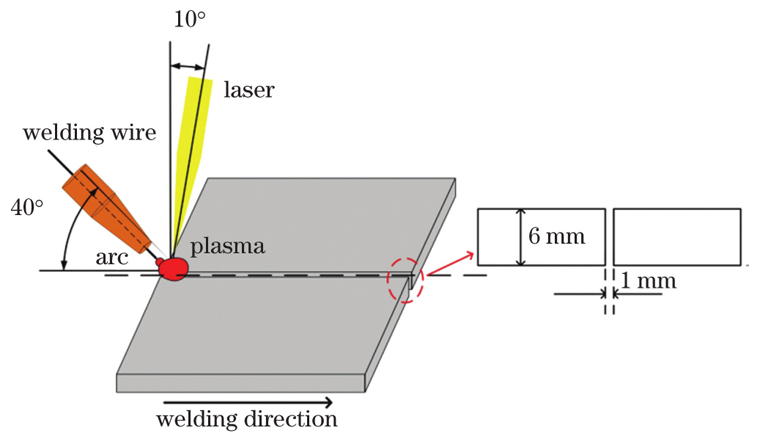
Fig. 1. Schematics of laser-arc hybrid welding system and groove
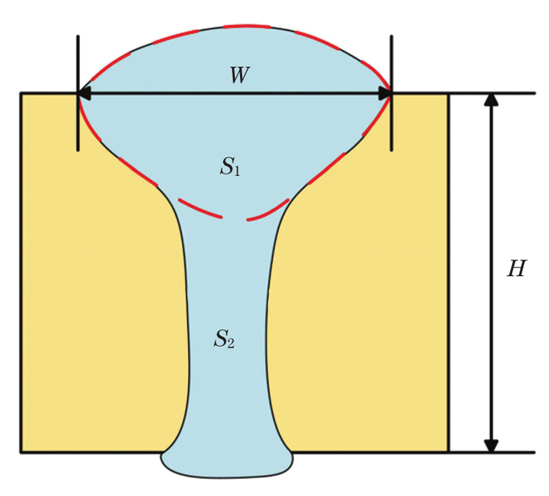
Fig. 2. Schematic of weld measurement area
Fig. 3. Influence curves of weld forming coefficient. (a) Scattered point distribution; (b) single factor disturbance curves; (c) contour lines characterizing interactions of P and Vw with ψ;(d) response surface characterizing interactions of P and Vw with ψ;(e) contour lines characterizing interactions of P and Vf with ψ;(f) response surface characterizing interactions of P and Vf with ψ;(g) contour lines characterizing interactions of Vw and Vf with ψ;(h) response surface characterizing interactions of Vw and Vf with ψ
Fig. 4. Influence curves of laser area ratio. (a) Scattered point distribution; (b) single factor disturbance curves; (c) contour lines characterizing interactions of P and Vw with R; (d) response surface characterizing interactions of P and Vw with R; (e) contour lines characterizing interactions of P and Vf with R; (f) response surface characterizing interactions of P and Vf with R; (g) contour lines characterizing interactions of Vw and Vf with R; (h) response surface characterizing interactions of Vw and Vf with R
Fig. 5. Typical weld morphologies under optimized process parameters (P=4250 W, Vw=16 mm/s, and Vf=13 m/min). (a) Front side; (b) back side; (c) cross-section
Element | C | Si | Mn | Cr | Ni | Mo | Cu | Nb | Ti | Co | Fe |
---|
Low-carbon bainite steel | 0.04 | 0.3 | 1.35 | 0.33 | 0.53 | 0.34 | 0.35 | 0.03 | 0.02 | <0.01 | Bal. | Welding wire | 0.06 | 0.37 | 1.49 | 0.34 | 2.84 | 0.35 | 0.1 | - | - | - | Bal. |
|
Table 1. Chemical compositions of low-carbon bainite steel and welding wire (mass fraction, %)
Experimental factor | Value |
---|
Low level | Zero level | High level |
---|
P/W | 4000 | 4250 | 4500 | Vw/(mm·s-1) | 14 | 16 | 18 | Vf/(m·min-1) | 12 | 13 | 14 |
|
Table 2. Process parameter levels for laser-MAG hybrid welding of low-carbon bainite steel
Process No. | Laser power P/W | Welding speed Vw /(mm·s-1) | Wire feeding speed Vf /(m·min-1) | Weld forming coefficient ψ | Laser area ratio R |
---|
1 | 4000 | 16.00 | 14.00 | 1.124 | 0.2355 | 2 | 4250 | 16.00 | 13.00 | 1.278 | 0.2589 | 3 | 4250 | 14.00 | 12.00 | 1.470 | 0.2119 | 4 | 4000 | 14.00 | 13.00 | 1.406 | 0.3054 | 5 | 4000 | 16.00 | 12.00 | 1.009 | 0.1634 | 6 | 4250 | 16.00 | 13.00 | 1.116 | 0.2280 | 7 | 4500 | 16.00 | 14.00 | 1.283 | 0.2806 | 8 | 4250 | 18.00 | 12.00 | 0.874 | 0.2196 | 9 | 4250 | 14.00 | 14.00 | 1.574 | 0.6008 | 10 | 4000 | 18.00 | 13.00 | 0.884 | 0.1103 | 11 | 4250 | 16.00 | 13.00 | 1.089 | 0.2093 | 12 | 4500 | 16.00 | 12.00 | 1.014 | 0.1830 | 13 | 4250 | 16.00 | 13.00 | 1.064 | 0.1899 | 14 | 4500 | 18.00 | 13.00 | 0.919 | 0.1310 | 15 | 4250 | 16.00 | 13.00 | 1.100 | 0.2199 | 16 | 4500 | 14.00 | 13.00 | 1.216 | 0.2562 | 17 | 4250 | 18.00 | 14.00 | 1.068 | 0.1928 |
|
Table 3. Statistics of test parameters and response values for laser-MAG hybrid welding of low-carbon bainite steel
Process No. | Front appearance of weld surface | Cross-sectional morphology | Weld formation |
---|
2 | | | Excess weld accumulation | 5 | | | Lack of penetration | 6 | | | Good form | 9 | | | Excessive penetration and overlap | 13 | | | Undercut | 15 | | | Pores | 16 | | | Good form | 17 | | | Undercut |
|
Table 4. Weld formation and cross-sectional morphology of low-carbon bainitic steel joint by laser-MAG hybrid welding
Source | Sum of squares | Degree of freedom | Mean square | F value | P value | Reliability |
---|
Model | 0.59 | 9 | 0.066 | 8.80 | 0.0045 | Significant | A | 1.075×10⁻⁵ | 1 | 1.075×10⁻⁵ | 1.434×10⁻³ | 0.9709 | | B | 0.46 | 1 | 0.46 | 61.44 | 0.0001 | | C | 0.058 | 1 | 0.058 | 7.76 | 0.0271 | | AB | 0.013 | 1 | 0.013 | 1.70 | 0.0958 | | AC | 5.863×10⁻³ | 1 | 5.863×10⁻³ | 0.78 | 0.4060 | | BC | 2.015×10⁻³ | 1 | 2.015×10⁻³ | 0.27 | 0.6203 | | A2 | 0.028 | 1 | 0.028 | 3.70 | 0.2335 | | B2 | 0.014 | 1 | 0.014 | 1.89 | 0.2118 | | C2 | 0.015 | 1 | 0.015 | 1.96 | 0.2041 | | Residual | 0.053 | 7 | 7.502×10⁻³ | | | | Lack of fitting value | 0.023 | 3 | 7.818×10⁻³ | 1.08 | 0.4538 | Not significant | Pure error | 0.029 | 4 | 7.266×10⁻³ | | | | Total | 0.65 | 16 | 0.066 | | | |
|
Table 5. Variance analysis of models for weld forming coefficient model
Source | Sum of squares | Degree of freedom | Mean square | F value | P value | Reliability |
---|
Model | 0.19 | 9 | 0.021 | 6.61 | 0.0105 | Significant | A | 1.638×10⁻⁴ | 1 | 1.638×10⁻⁴ | 0.052 | 0.8254 | | B | 0.11 | 1 | 0.11 | 36.15 | 0.0005 | | C | 0.039 | 1 | 0.039 | 12.63 | 0.0093 | | AB | 1.222×10⁻³ | 1 | 1.222×10⁻³ | 0.39 | 0.5516 | | AC | 1.626×10⁻⁴ | 1 | 1.626×10⁻⁴ | 0.052 | 0.8261 | | BC | 8.621×10⁻³ | 1 | 8.621×10⁻³ | 2.76 | 0.0989 | | A2 | 0.011 | 1 | 0.011 | 3.62 | 0.1407 | | B2 | 4.135×10⁻³ | 1 | 4.135×10⁻³ | 1.32 | 0.2878 | | C2 | 9.002×10⁻³ | 1 | 9.002×10⁻³ | 2.88 | 0.1334 | | Residual | 0.022 | 7 | 3.125×10⁻³ | | | | Lack of fitting value | 0.019 | 3 | 6.427×10⁻³ | 9.92 | 0.0252 | Not significant | Pure error | 2.591×10⁻³ | 4 | 6.476×10⁻⁴ | | | | Total | 0.21 | 16 | | | | |
|
Table 6. Variance analysis of models for laser area ratio model
Response indicator | Laser power P /W | Welding speed Vw /(mm·s-1) | Wire feeding speed Vf /(m·min-1) |
---|
ψ=1.1-1.2 | 4000-4300 | 15.3-16.3 | 12.3-13.6 | R=0.2-0.3 | 4120-4300 | 14.8-16.4 | 11.5-13.6 | Optimal interval | 4120-4300 | 15.3-16.3 | 12.3-13.6 |
|
Table 7. Optimized process parameter range for laser-MAG hybrid welding of low-carbon bainite steel
Test parameter | ψ | R | Average value | Accuracy /% |
---|
P /W | Vw /(mm·s-1) | Vf /(m·min-1) | ψ | R | ψ | R |
---|
4250 | 16.0 | 13 | 1.15 | 0.24 | 1.19 | 0.26 | 95.0 | 92.3 | 4200 | 15.5 | 13 | 1.23 | 0.27 |
|
Table 8. Statistical test results of ψ and R