
Hong-bo Cai, Xin-xin Yan, Pei-lin Yao, Shao-ping Zhu. Hybrid fluid–particle modeling of shock-driven hydrodynamic instabilities in a plasma[J]. Matter and Radiation at Extremes, 2021, 6(3): 035901
- Matter and Radiation at Extremes
- Vol. 6, Issue 3, 035901 (2021)
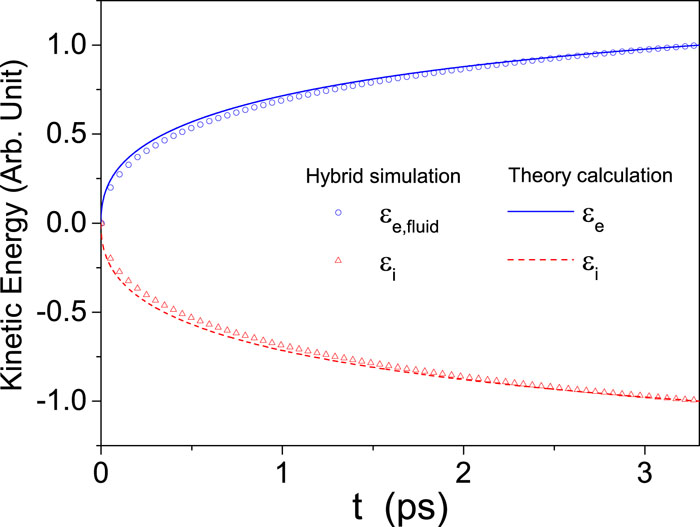
Fig. 1. Energy transfer between fluid electrons and particle ions of mass M = 1836m e at density n e = 1024 cm−3. The circles and triangles indicate the simulation results, and the solid and dashed lines are calculated using Eq. (23) . Here, all the energies are normalized by the maximum increment of the energy of the electron fluid at the end of the simulation time.
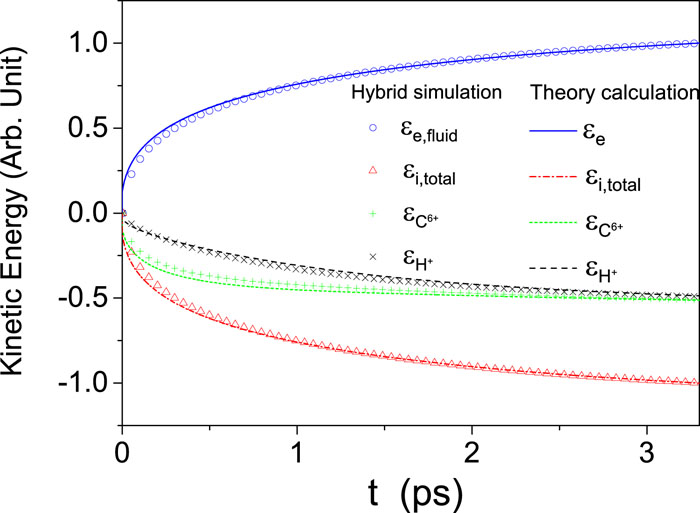
Fig. 2. Energy transfer between fluid electrons and two species of ions (C:H = 1:1) at density n e = 1024 cm−3. The symbols indicate the simulation results, and the lines are calculated using Eq. (23) . Here, all the energies are normalized by the maximum increment of the energy of the electron fluid at the end of the simulation time.
Fig. 3. Initial conditions for simulations of a piston-driven planar shock propagation through the perturbed interface separating two fluids of different densities.
Fig. 4. Snapshots of the distribution of the logarithm of mass density (in units of g/cm3) at times 2.02 ps (a), 4.04 ps (b), 6.07 ps (c), and 8.09 ps (d), showing the evolution of a single-mode hydrogen/carbon interface. IS denotes the incident shock, RS the reflected shock, TS the transmitted shock, and CRS the convergent reflected shock. As the incident shock wave passes through the plasma interface, it generates a slower second shock in the heavy plasma and a reflected shock running backward into the light plasma. The black contour near the interface encloses the region within which the fractions of both ion populations exceed 10%. This is the so-called ion mixing region.
Fig. 5. Snapshots of self-generated magnetic fields B z (in units of T) for RMI at times 2.02 ps (a), 4.04 ps (b), 6.07 ps (c), and 8.09 ps (d).
Fig. 6. (a) Initial conditions for simulation of ion kinetic effects on growth of Rayleigh–Taylor instability. (b)–(d) Snapshots of the distribution of the logarithm of mass density (in units of g/cm3) at times 50 ps, 100 ps, and 150 ps, respectively, showing the evolution of a single-mode heavy/light plasma interface. The black contour near the interface encloses the region within which the fractions of both ion populations exceed 10% (the ion mixing region).
Fig. 7. Snapshots of the distribution of self-generated magnetic fields B z (in units of T) for RTI at times 50 ps (a), 100 ps (b), and 150 ps (c).

Set citation alerts for the article
Please enter your email address
© Copyright 2018-2021 | Chinese Laser Press. All Rights Reserved 沪ICP备15018463号-20