
Andi Zhang, Yanrong Zhang, Tao Li. Application of Variable Domain Fuzzy PID Control in Semiconductor Laser Temperature Control System[J]. Acta Optica Sinica, 2021, 41(12): 1214003
- Acta Optica Sinica
- Vol. 41, Issue 12, 1214003 (2021)
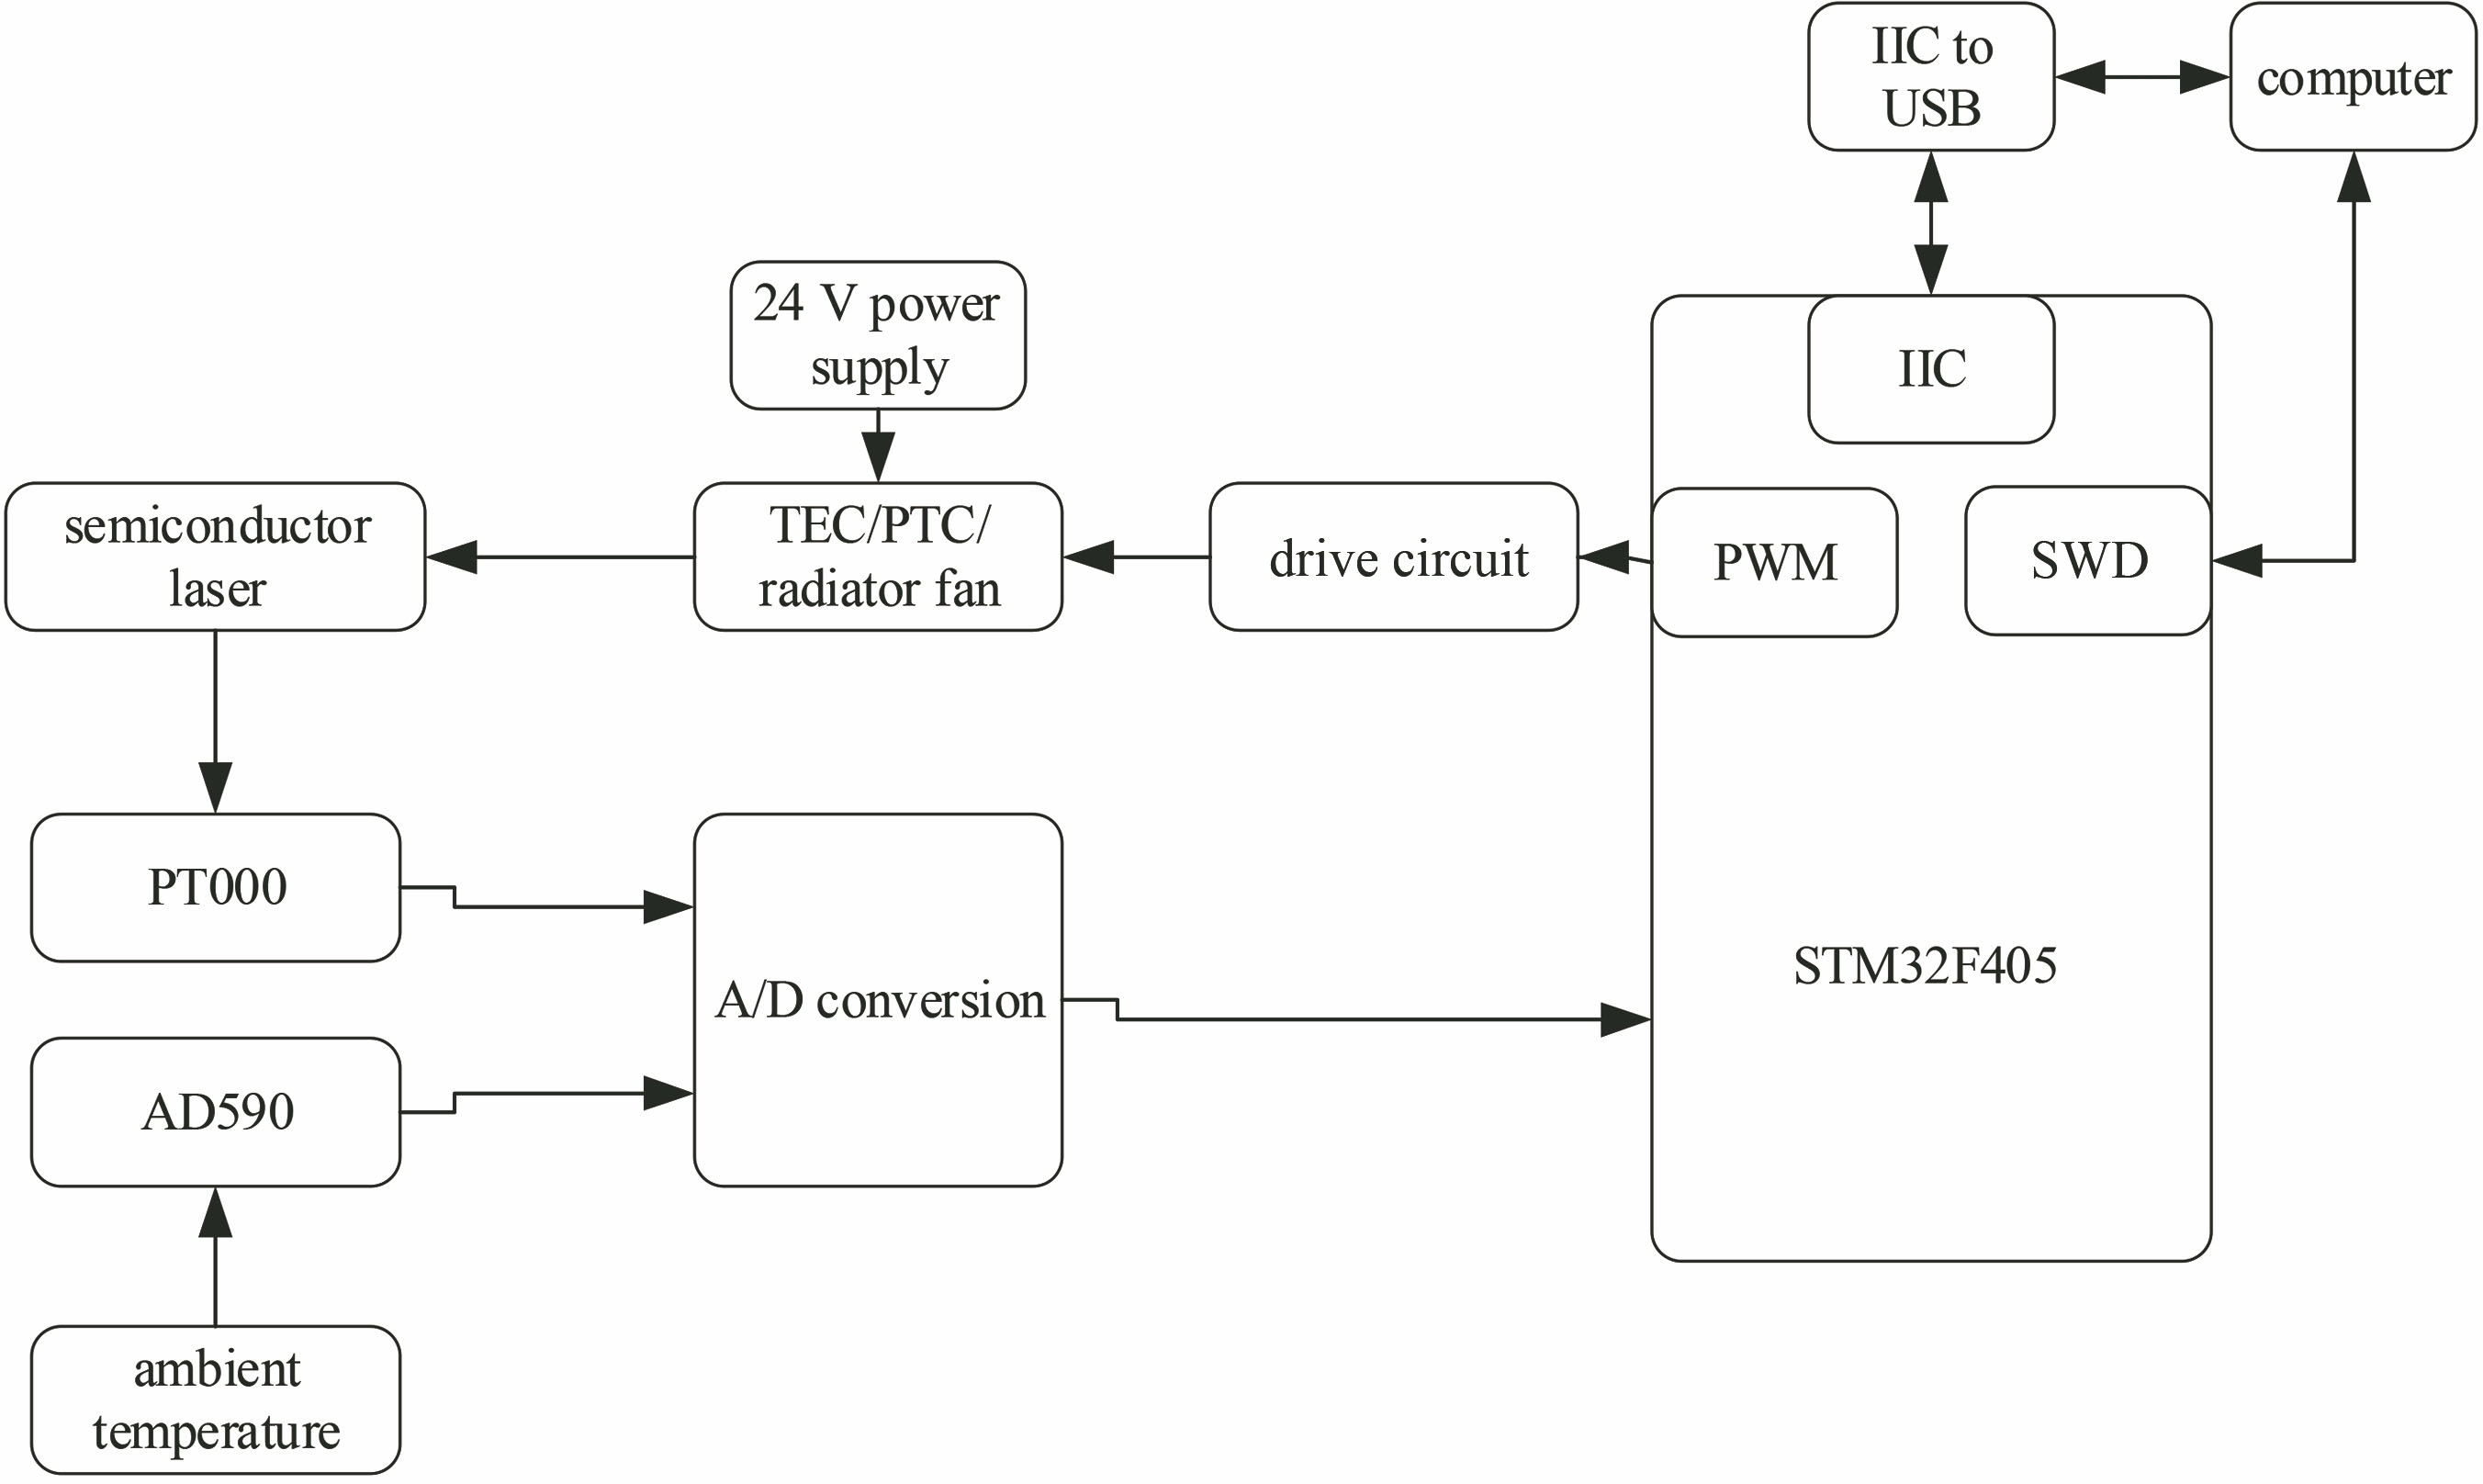
Fig. 1. Structure of temperature control system
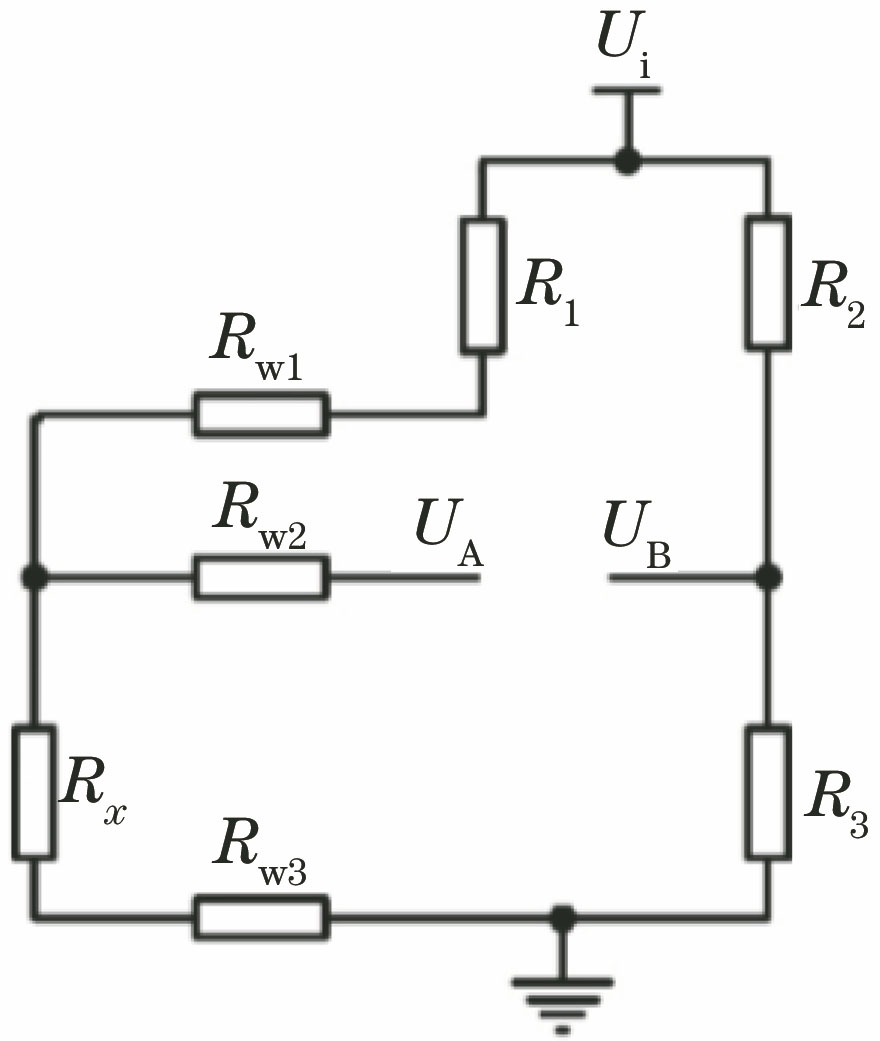
Fig. 2. PT1000 three wire connection method
Fig. 3. Three-wire PT1000 temperature measurement module
Fig. 4. Voltage amplifier circuit
Fig. 5. Temperature measurement and acquisition module
Fig. 6. TEC and PTC control circuit
Fig. 7. Extractor fan control circuit
Fig. 8. Variable domain fuzzy PID control structure
Fig. 9. Mathematical model of temperature control system
Fig. 10. Simulation model of variable domain fuzzy PID control
Fig. 11. Comparison of response curves of three controllers
Fig. 12. System test platform
Fig. 13. Test result when PWM duty cycle is set to 50%
Fig. 14. Voltage of A/D conversion module
Fig. 15. Test result at target temperature of 60 ℃
Fig. 16. Test result at target temperature of 40 ℃
|
Table 1. Test data sheet

Set citation alerts for the article
Please enter your email address
© Copyright 2018-2021 | Chinese Laser Press. All Rights Reserved 沪ICP备15018463号-20