Abstract
In this paper, we report the experimental characterization of highly nonlinear GeSbS chalcogenide glass waveguides. We used a single-beam characterization protocol that accounts for the magnitude and sign of the real and imaginary parts of the third-order nonlinear susceptibility of integrated (GeSbS) chalcogenide glass waveguides in the near-infrared wavelength range at . We measured a waveguide nonlinear parameter of , which corresponds to a nonlinear refractive index of , comparable to that of silicon, but with an 80 times lower two-photon absorption coefficient , accompanied with linear propagation losses as low as 0.5 dB/cm. The outstanding linear and nonlinear properties of GeSbS, with a measured nonlinear figure of merit at , ultimately make it one of the most promising integrated platforms for the realization of nonlinear functionalities.1. INTRODUCTION
Chalcogenide glasses appear as a very promising solution for the implementation of high-performance integrated optical waveguides [1], as they provide a wide range of compelling properties, including strong light confinement, broadband transparency in the visible and infrared wavelength ranges, material engineering based on tailorable alloy composition, low phonon energies, and remarkably large nonlinearities (400 times higher than in silica [2]).
These kinds of glasses are typically formed by alloying chalcogen elements, such as S, Se, and Te, with network forming elements like As, Sb, or Ge. As-based chalcogenides have demonstrated outstanding nonlinear properties, e.g., showing ultra-wideband supercontinuum generation in optical fibers [3] and integrated waveguides [4]. However, despite the important glass-forming role of arsenic in many infrared glass compositions, its toxicity in its elemental form can often limit its use. On the other hand, ternary Ge-Sb-S chalcogenides allow flexible band-gap engineering by composition tuning, while providing high refractive indices () and broadband transparency (from the visible up to mid-infrared wavelengths). Specifically, the chalcogenide has shown a great potential for the implementation of flexible photonic components [5] and mid-infrared devices [6]. Preliminary experimental characterizations of integrated waveguides in the near-infrared showed a remarkably large nonlinear refractive index with a nonlinear effective susceptibility of [7]. The waveguide used supported more than one transverse mode, which may have an influence on the measurement of the Kerr nonlinearity. Recently, nonlinear characterizations of GeSbSe chalcogenide thin films have been reported with a Kerr coefficient 9 times larger than in GeSbS materials [8], as the substitution of sulfur by selenium allows an increase in [9]. Nevertheless, as this approach decreases the material bandgap, GeSbSe chalcogenide materials support a higher two-photon absorption (TPA) coefficient , corresponding to a nonlinear figure of merit comprised between 1.3 and 2.6 at [8].
In this paper, we have specifically designed and fabricated (GeSbS) waveguides operating in a single-mode regime in the near-infrared and with linear propagation losses as low as 0.5 dB/cm. This result at wavelengths around 1550 nm is on par with the state of the art of other families of chalcogenide glasses, such as 0.05 dB/cm loss in , although it is measured in a large-core rib so not directly comparable to a small-core strip [10], 0.52 dB/cm in hot embossed smaller rib waveguides [11] or in rib waveguides fabricated with Te-Ge-Se ternary systems [12]. The nonlinear GeSbS waveguide characterization has been performed at 1580 nm by combining a bidirectional top-hat spectral broadening measurement and a dispersive scan (D-Scan) experiment [13,14]. The bidirectional nonlinear characterization enables an accurate measurement of the coupling efficiencies, which is essential to quantify the injected power and therefore the effective third-order nonlinear susceptibilities of the waveguide. The real part of the latter implies a modification of the refractive index through the optical nonlinear Kerr refractive index, , whereas its imaginary part induces an excess of loss as the injected power in the waveguide increases, and is related to the TPA coefficient . Our measurements confirm the large positive in glass and show a non-negligible TPA coefficient , revealing in the near-infrared an , around 15, 4.5, and 2.3 times larger than that of silicon, , and , respectively.
2. SAMPLE FABRICATION
To fabricate the chalcogenide waveguides, a 420 nm thick GeSbS layer is evaporated on an oxide coated silicon wafer. The waveguides are defined by electron beam lithography and a reactive ion etching (RIE) is carried out. An SU8 polymer cladding is then deposited by spin coating. The specific details on the material and fabrication flow can be found in Ref. [15]. Figure 1(a) shows a scanning electron microscopy (SEM) image of the fabricated layer stack. Strip waveguides with 420 nm height and 800 nm width are used to provide single-mode operation for the transverse-electric (TE) polarized mode in the near-infrared. The high index contrast and tight core dimensions result in a fundamental TE mode depicted in Fig. 1(b), with a nonlinear area of , calculated from where and are, respectively, the electric and magnetic field distributions, is a unit vector in the propagation direction, and are the permittivity and the speed of light in vacuum, denotes the linear refractive index, and defines the nonlinear material area (i.e., the waveguide core). The contributions to the waveguide nonlinearity from the silicon dioxide and the SU8 are neglected due to their substantially smaller nonlinear material coefficients [16,17] and due to the weak fraction of the modal energy in the SU8 and silica boxes, respectively, calculated to 22.5% and 10% using Lumerical MODE solutions. After a frequency analysis of the simulated structures, we have calculated a propagation constant , group index and dispersion coefficient for the TE fundamental mode at 1580 nm wavelength. As the difference between the group index and the material index is not considerable (), the enhancement factor has been neglected. Linear characterizations of the fabricated strip waveguides have been performed by recording spectral transmission with a tunable extended cavity laser diode from 1510 to 1610 nm, as shown in Fig. 1(c). From complementary measurements with ring resonators, we have determined linear propagation losses as low as at 1580 nm [15], corresponding to the highest loss of at lower wavelengths.
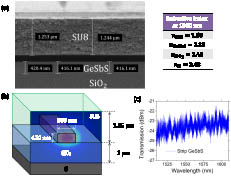
Figure 1.(a) SEM image and refractive indices at 1580 nm of the layer stack. (b) GeSbS waveguide structure with a superposition of the fundamental TE-mode profile. (c) Linear optical transmission of the 1 cm long chalcogenide waveguide.
3. RESULTS AND DISCUSSION
To measure the real and imaginary parts of the third-order nonlinear susceptibility of the fabricated waveguides and extract its TPA figure of merit, , we have implemented a top-hat bidirectional nonlinear transmission method. This approach provides a precise measurement of the fraction of incident power that is injected inside the waveguide, assessing with accuracy the magnitude of the waveguide effective nonlinearities. A complementary D-Scan measurement [14] is used to determine the sign of the real effective susceptibility. The D-Scan method adapts the widely used Z-Scan method for bulk material to the nonlinear characterization of waveguides [18]. In the Z-Scan, the nonlinear bulk material behaves as a spatial Kerr lens, focusing or defocusing a strong incident beam according to the nonlinear material properties [19]. In an analogous way, a waveguide tested under D-Scan acts as a temporal Kerr lens, modifying the spectral width of the output pulses [14]. Whereas the spatial beam extension is measured in Z-Scan by translating the material position throughout the focused beam location, the output spectral behaviors are recorded in D-Scan by varying the linear chirp coefficient applied on the incident pulses.
Optical pulses from a mode-locked erbium-doped fiber laser (150 fs pulse duration at a repetition rate of 50 MHz) are sent through a grating-based pulse shaper, which generates rectangular-like spectra with a linewidth of 7.3 nm and introduces an adjustable second-order dispersion coefficient . This second-order term corresponds to the same dispersion order induced by the propagation of the pulse in a dispersive waveguide (). The chosen spectral shape improves the measurement sensitivity on the spectral broadening related to the Kerr-induced self-phase modulation (SPM) effect [20]. This enhanced sensitivity is due to the steeper spectral gradient in the rectangular-like shape edges, allowing the more accurate detection of nonlinearly generated frequencies in the wings. The measured auto-correlation pulse duration at is 2 ps, close to the Fourier-limit [21]. Following the injection inside a 2 m long polarization maintaining (PM) fiber (from which the small nonlinear contribution has been characterized and considered), a microscope objective is used to inject the chirped pulses into the chalcogenide waveguide with a geometrical length . A simplified scheme of the bidirectional setup is presented in Fig. 2(a), for which a detailed description is given in Ref. [14]. This setup allows us to perform two counter-directional nonlinear transmissions by connecting a set of PM fibers. The incident average power is measured at the output of the pulse shaper, while the power after the integrated waveguide under study is measured by integrating the spectra recorded with an optical spectrum analyzer (OSA) over all the wavelengths, as shown in Fig. 2(a). In order to recover the real power injected inside the waveguide for both directions, we take into account the coupling efficiencies and from both waveguide facets and the losses introduced by the set of PM fibers on the injection and output sides of the setup, respectively, denoted and , where the superscripts 1 and 2 refer to the injection directions identified in Fig. 2(a).

Figure 2.(a) Bidirectional nonlinear transmission setup. Following the injection from both chalcogenide facets A and B, (b) measured output spectra varying the average input powers between 0.5 and 11 mW, and (c) experimental (solid lines) and simulated (dashed lines) output spectra at , where the nonlinear phase shift for the simulated spectra coincides to and .
Outgoing spectra registered for average input powers comprised between 2 and 11 mW, and setting , are plotted in Fig. 2(b) for both injection directions 1 and 2. The increase in the spectral broadening with and the symmetric shape of the spectra [as illustrated in Fig. 2(c) for ], emphasize an SPM effect induced by an intensity-dependent optical Kerr phase shift. In addition, symmetric spectra qualitatively demonstrate the absence of slow effects changing the refractive index, ensuring that the instantaneous Kerr optical effect is the source of the refractive index variation. Actually, the variation of the output power presents a linear dependence on the input power (curve not given), meaning that the TPA effect is negligible. Finally, one can notice from Fig. 2(c) that the spectral broadening differs with the facet selected for the injection, as a larger spectral broadening can be observed with an injection through the facet A, which corresponds to the direction 1 shown in Fig. 2(a). This comparison underlines the common inaccurate assumption and the necessity in measuring the coupling efficiencies, which is rarely detailed in the literature, even though it is critical for the nonlinear characterization of high-index contrast integrated devices.
The rectangular or top-hat like spectral shape used for the input pulses, associated with a 40 dB dynamic measurement on the output spectra, enables us to detect SPM spectral broadening at very low power, anticipating nonlinear phase shift measurements with a high sensitivity. To estimate the nonlinear phase shift, we have simulated the SPM effect on the pulses through their propagation in a nonlinear Kerr medium. Neglecting TPA, the nonlinear phase shift is quantified by the relation where , with being the linear propagation loss. The parameter links the injected peak power and the incident average power through and , and is defined by with being the temporal pulse shape and the repetition rate of the laser. The parameter denotes the effective waveguide nonlinear susceptibility, which characterizes the nonlinear performance of the waveguide.
To analyze quantitatively the spectral features, the root mean squared (r.m.s.) widths of the measured output spectra are plotted with open circles as a function of in Figs. 3(a) and 3(b), respectively, for the injection directions 1 and 2. Next, we have calculated the spectral broadening of pulses with an envelope shape , where to match with the autocorrelation measurement of the input pulse. The pulse shaper characterization is detailed in Ref. [21]. The output spectra are numerically calculated following the Fourier transform of the pulse envelope at the waveguide output given by , with . By doing so, we have neglected the dispersion effect of the waveguide as the dispersion length () is equal to 1.48 m, being much longer than the waveguide length. Notice that the pulse intensity can be considered constant along z: no TPA, low linear absorption. The calculated output spectrum is then simply given by processing the Fourier transform of . Varying the nonlinear phase shift , with values given on the top axis, the r.m.s. widths of the simulated spectra are plotted with solid lines in Figs. 3(a) and 3(b). By using the one-to-one correspondence between experimental and simulated 2 values, a relation between the nonlinear phase shift and the average input power can be plotted for the two directions as shown in the insets of Figs. 3(a) and 3(b). As expected from Eq. (2), the nonlinear phase shift for both directions linearly varies with the incident power. Following a linear fit, one finds and , for directions 1 and 2, respectively. The ratio between the two slopes gives . The losses and are determined by measuring the beam power in various locations of the setup [see Fig. 2(a)], and they are, respectively, equal to 25% and 26%, implying that the ratio . A second relation between the efficiencies and can be derived using the measured linear dependence between and , for which the linear fit gives . Knowing that , and measuring on the bench , one finds a second relation . Combining those two relations between the coupling efficiencies achieved through each facet of the waveguide, their values are measured equal to and , where the uncertainties are calculated from the 95% confidence intervals for the various fit coefficients.
Figure 3.Injecting from (a) the facet A and (b) the facet B output spectral r.m.s. width 2 measured as a function of the average input power (open circles) and calculated for various nonlinear phase shift (solid lines). Insets: extraction of the nonlinear phase shift as a function of .
By using the relation in Eq. (2) and knowing the coupling efficiencies, it is possible to quantify the effective real nonlinear susceptibility . It is worth noticing that our characterization has been performed in a single-mode waveguide with a constant transverse-mode area and taking special care of the measurement of the injected power.
From the calculation of the effective nonlinear area using the mode distribution depicted in Fig. 1, and from the relation , the nonlinear refractive index of the GeSbS chalcogenide material is measured equal to , which remains in the same order of magnitude of silicon and two orders of magnitude larger than that of silicon dioxide.
Up to this point, all measurements were carried out with no chirp pulses, setting . To define the sign and verify the magnitude of the measured nonlinear refractive index, we have performed a D-Scan measurement [13] adapted for integrated devices [14]. Setting the incident power to 10 mW and the direction 1, output spectra are recorded for various second-order dispersion coefficients applied to the injected pulse by means of the pulse shaper. The evolution of the spectra with is shown in Fig. 4(a), from which the r.m.s. spectral linewidth is measured and plotted with in Fig. 4(c) (dots). The latter curve follows a dispersive shape nearby , and a maximum broadening is reached in the normal dispersion regime (), implying that (and ) for GeSbS at 1580 nm. For large dispersion coefficients, either positive or negative, the pulse duration is too large to efficiently generate SPM-induced spectral broadening, and tends to its linear value.
Figure 4.(a) Experimental spectra for and (b) simulated spectra for by varying the second-order dispersion coefficient . (c) D-Scan traces showing the measured (open circles) and simulated (solid lines) variation of the r.m.s spectral linewidth with .
As done previously, the spectral broadening experienced by the chirped sinus cardinal shaped pulses can be calculated for different nonlinear phase shift and values. Using the previously determined values for the coupling efficiencies and , the calculated output spectra at [corresponding to a measured at ; see Fig. 3(a)] and for comprised between to , are plotted in Fig. 4(b). The evolution of the related r.m.s spectral linewidth with is reported in Fig. 4(c) in solid line. The agreement between the experimental and simulated behaviors for the r.m.s. spectral linewidth confirms the magnitude of the nonlinear refractive index measured in our experiment.
To quantify the TPA effect, we modified the original setup by removing the PM fibers in order to increase the injected power. Note that a bidirectional nonlinear transmission cannot be conducted with this modified setup, as the coupling efficiency at each facet and for the two directions cannot be kept equal anymore. As a result of the higher available power, we can achieve larger spectral broadening as shown in Fig. 5(b) and try to detect possible power-dependent losses. The direction of the light injection is kept from the facet A of the sample. In Fig. 5(c), the ratio between the input and output average powers versus is presented. Under TPA effect, this ratio is expected to linearly vary with the input power following [14,22] where the slope is related to the TPA nonlinear losses. Using a linear fit plotted with a solid line in Fig. 5(c), one may extract the two-photon absorption coefficient () through where the fit values and are () and (, respectively. However, the coupling efficiency remains unknown. We have used a dagger () to denote different coupling efficiencies as the injection conditions were modified. Considering that the real part of the effective waveguide nonlinear susceptibility () is known, the new coupling efficiency can be extracted from the spectral broadening measured at low powers (where the TPA is negligible). In Fig. 5(a), we have followed the procedure applied above in the bidirectional nonlinear transmission to trace back the relation between the nonlinear phase shift and the input power, which shows , enabling us to determine .
Figure 5.(a) Output spectral r.m.s. width measured as a function of the average input power (open circles) and calculated for various nonlinear phase shifts (solid lines). Inset: Extraction of the nonlinear phase shift as a function of . (b) Output spectra measured for varied between 4 and 15 mW, with a top-hat-like spectrum measured at low power (linear transmission). (c) Experimental (open circles) and linear fit (solid line) of the ratio versus .
Finally, and using the relation in Eq. (4), we estimate a non-negligible TPA coefficient of . The band gap of the GeSbS films is around 2.5 eV [7], meaning that the energy of two photons at 1580 nm is not enough to promote one electron from the valence band to the conduction band. Still, there could be other sources of power-dependent losses, such as nonlinear absorption due to band tail states [2]. Further studies may be required to establish the source of the observed power evolution trends. Nevertheless, this second-order nonlinear loss is more than 80 times smaller than that of silicon at this wavelength [23].
In conclusion, we can estimate the TPA figure of merit . This represents one of the highest nonlinear figure of merits accompanied with small propagation losses reported in integrated photonic materials at telecom wavelengths [24].
We have summarized the main experimental values in Table 1.
| Parameter | Value |
| κFA | (22.5±0.2)% |
| κFB | (14.5±0.4)% |
| η | 14,600 |
| κFA† | (10±1)% |
| n2 | (0.93±0.08)×10−18 m2/W |
| FOMTPA | 6.0±1.4 |
Table 1. Experimental Values at
4. CONCLUSION
We have used a precise single-beam top-hat bidirectional nonlinear transmission to simultaneously and accurately measure the coupling efficiencies of the integrated waveguide and the magnitude of the effective waveguide Kerr coefficient (). We have verified these measurements and determined the positive sign of the nonlinear refractive index of the material by performing a D-Scan experiment. The measured value for the GeSbS-based waveguide is of the same order of silicon, but with substantially lower nonlinear loss, resulting in a nonlinear figure merit of , which is 15 times larger than in silicon. The remarkable nonlinear property, together with the low linear propagation loss (of ), places these GeSbS chalcogenide waveguides as a very promising As-free nonlinear integrated platform, thereby opening a new route for the realization of a myriad of on-chip nonlinear functionalities. These emerging applications include, among others, supercontinuum and frequency comb generation with a tremendous beneficial impact in applications like high-resolution signal processing, optical frequency metrology, and micro-spectroscopy.
References
[1] B. J. Eggleton, B. Luther-Davies, K. Richardson. Chalcogenide photonics. Nat. Photonics, 5, 141-148(2011).
[2] J. Harbold, F. Ilday, F. Wise, J. Sanghera, V. Nguyen, L. Shaw, I. Aggarwal. Highly nonlinear As–S–Se glasses for all-optical switching. Opt. Lett., 27, 119-121(2002).
[3] T. Cheng, K. Nagasaka, T. H. Tuan, X. Xue, M. Matsumoto, H. Tezuka, T. Suzuki, Y. Ohishi. Mid-infrared supercontinuum generation spanning 2.0 to 15.1 μm in a chalcogenide step-index fiber. Opt. Lett., 41, 2117-2120(2016).
[4] Y. Yu, X. Gai, P. Ma, K. Vu, Z. Yang, R. Wang, D.-Y. Choi, S. Madden, B. Luther-Davies. Experimental demonstration of linearly polarized 2-10 μm supercontinuum generation in a chalcogenide rib waveguide. Opt. Lett., 41, 958-961(2016).
[5] L. Li, H. Lin, S. Qiao, Y. Zou, S. Danto, K. Richardson, J. D. Musgraves, N. Lu, J. Hu. Integrated flexible chalcogenide glass photonic devices. Nat. Photonics, 8, 643-649(2014).
[6] V. Singh, P. T. Lin, N. Patel, H. Lin, L. Li, Y. Zou, F. Deng, C. Ni, J. Hu, J. Giammarco, A. P. Soliani, B. Zdyrko, I. Luzinov, S. Novak, J. Novak, P. Wachtel, S. Danto, J. D. Musgraves, K. Richardson, L. C. Kimerling, A. M. Agarwal. Mid-infrared materials and devices on a Si platform for optical sensing. Sci. Technol. Adv. Mater., 15, 014603(2014).
[7] J. W. Choi, Z. Han, B.-U. Sohn, G. F. Chen, C. Smith, L. C. Kimerling, K. A. Richardson, A. M. Agarwal, D. T. Tan. Nonlinear characterization of GeSbS chalcogenide glass waveguides. Sci. Rep., 6, 39234(2016).
[8] T. Kuriakose, E. Baudet, T. Halenkovič, M. M. Elsawy, P. Němec, V. Nazabal, G. Renversez, M. Chauvet. Measurement of ultrafast optical Kerr effect of Ge–Sb–Se chalcogenide slab waveguides by the beam self-trapping technique. Opt. Commun., 403, 352-357(2017).
[9] T. Cardinal, K. Richardson, H. Shim, A. Schulte, R. Beatty, K. Le Foulgoc, C. Meneghini, J. Viens, A. Villeneuve. Non-linear optical properties of chalcogenide glasses in the system As–S–Se. J. Non-Cryst. Solids, 256, 353-360(1999).
[10] S. J. Madden, D.-Y. Choi, D. A. Bulla, A. V. Rode, B. Luther-Davies, V. Ta’eed, M. Pelusi, B. Eggleton. Long, low loss etched As2S3 chalcogenide waveguides for all-optical signal regeneration. Opt. Express, 15, 14414-14421(2007).
[11] T. Han, S. Madden, S. Debbarma, B. Luther-Davies. Improved method for hot embossing As2S3 waveguides employing a thermally stable chalcogenide coating. Opt. Express, 19, 25447-25453(2011).
[12] C. Vigreux, M. V. Thi, G. Maulion, R. Kribich, A. Pradel. Te-Ge-Se thermally co-evaporated films: elaboration, characterization and use for the manufacture of IR rib waveguides, basic elements of CO2 microsensors. 15th International Conference on Transparent Optical Networks (ICTON), 1-5(2013).
[13] F. Louradour, E. Lopez-Lago, V. Couderc, V. Messager, A. Barthelemy. Dispersive-scan measurement of the fast component of the third-order nonlinearity of bulk materials and waveguides. Opt. Lett., 24, 1361-1363(1999).
[14] S. Serna, N. Dubreuil. Bi-directional top-hat D-Scan: single beam accurate characterization of nonlinear waveguides. Opt. Lett., 42, 3072-3075(2017).
[15] Q. Du, Y. Huang, J. Li, D. Kita, J. Michon, H. Lin, L. Li, S. Novak, K. Richardson, W. Zhang, J. Hu. Low-loss photonic device in Ge–Sb–S chalcogenide glass. Opt. Lett., 41, 3090-3093(2016).
[16] G. P. Agrawal. Nonlinear Fiber Optics(2007).
[17] C. Donnelly, D. T. Tan. Ultra-large nonlinear parameter in graphene-silicon waveguide structures. Opt. Express, 22, 22820-22830(2014).
[18] E. Lopez-Lago, V. Messager, F. Louradour, V. Couderc, A. Barthelemy. Characterization of the fast component of the complex third-order nonlinearity and time response of bulk materials and waveguides. J. Opt. Soc. Am. B, 18, 1166-1173(2001).
[19] M. Sheik-Bahae, A. A. Said, T.-H. Wei, D. J. Hagan, E. W. Van Stryland. Sensitive measurement of optical nonlinearities using a single beam. IEEE J. Quantum Electron., 26, 760-769(1990).
[20] W. Zhao, P. Palffy-Muhoray. Z-scan technique using top-hat beams. Appl. Phys. Lett., 63, 1613-1615(1993).
[21] S. Serna, J. Oden, M. Hanna, C. Caer, X. Le Roux, C. Sauvan, P. Delaye, E. Cassan, N. Dubreuil. Enhanced nonlinear interaction in a microcavity under coherent excitation. Opt. Express, 23, 29964-29977(2015).
[22] A. Baron, A. Ryasnyanskiy, N. Dubreuil, P. Delaye, Q. V. Tran, S. Combrié, A. De Rossi, R. Frey, G. Roosen. Light localization induced enhancement of third order nonlinearities in a GaAs photonic crystal waveguide. Opt. Express, 17, 552-557(2009).
[23] M. Dinu, F. Quochi, H. Garcia. Third-order nonlinearities in silicon at telecom wavelengths. Appl. Phys. Lett., 82, 2954-2956(2003).
[24] L. Chen, F. Chen, S. Dai, G. Tao, L. Yan, X. Shen, H. Ma, X. Zhang, Y. Xu. Third-order nonlinearity in Ge–Sb–Se glasses at mid-infrared wavelengths. Mater. Res. Bull., 70, 204-208(2015).


