
Maosheng HOU, Yuqing CHEN, Zhengxue SHI, Zhuyue LI. Self-calibration Method of Laser Scanning Projection System Combined with Monocular Vision[J]. Acta Photonica Sinica, 2021, 50(2): 134
- Acta Photonica Sinica
- Vol. 50, Issue 2, 134 (2021)
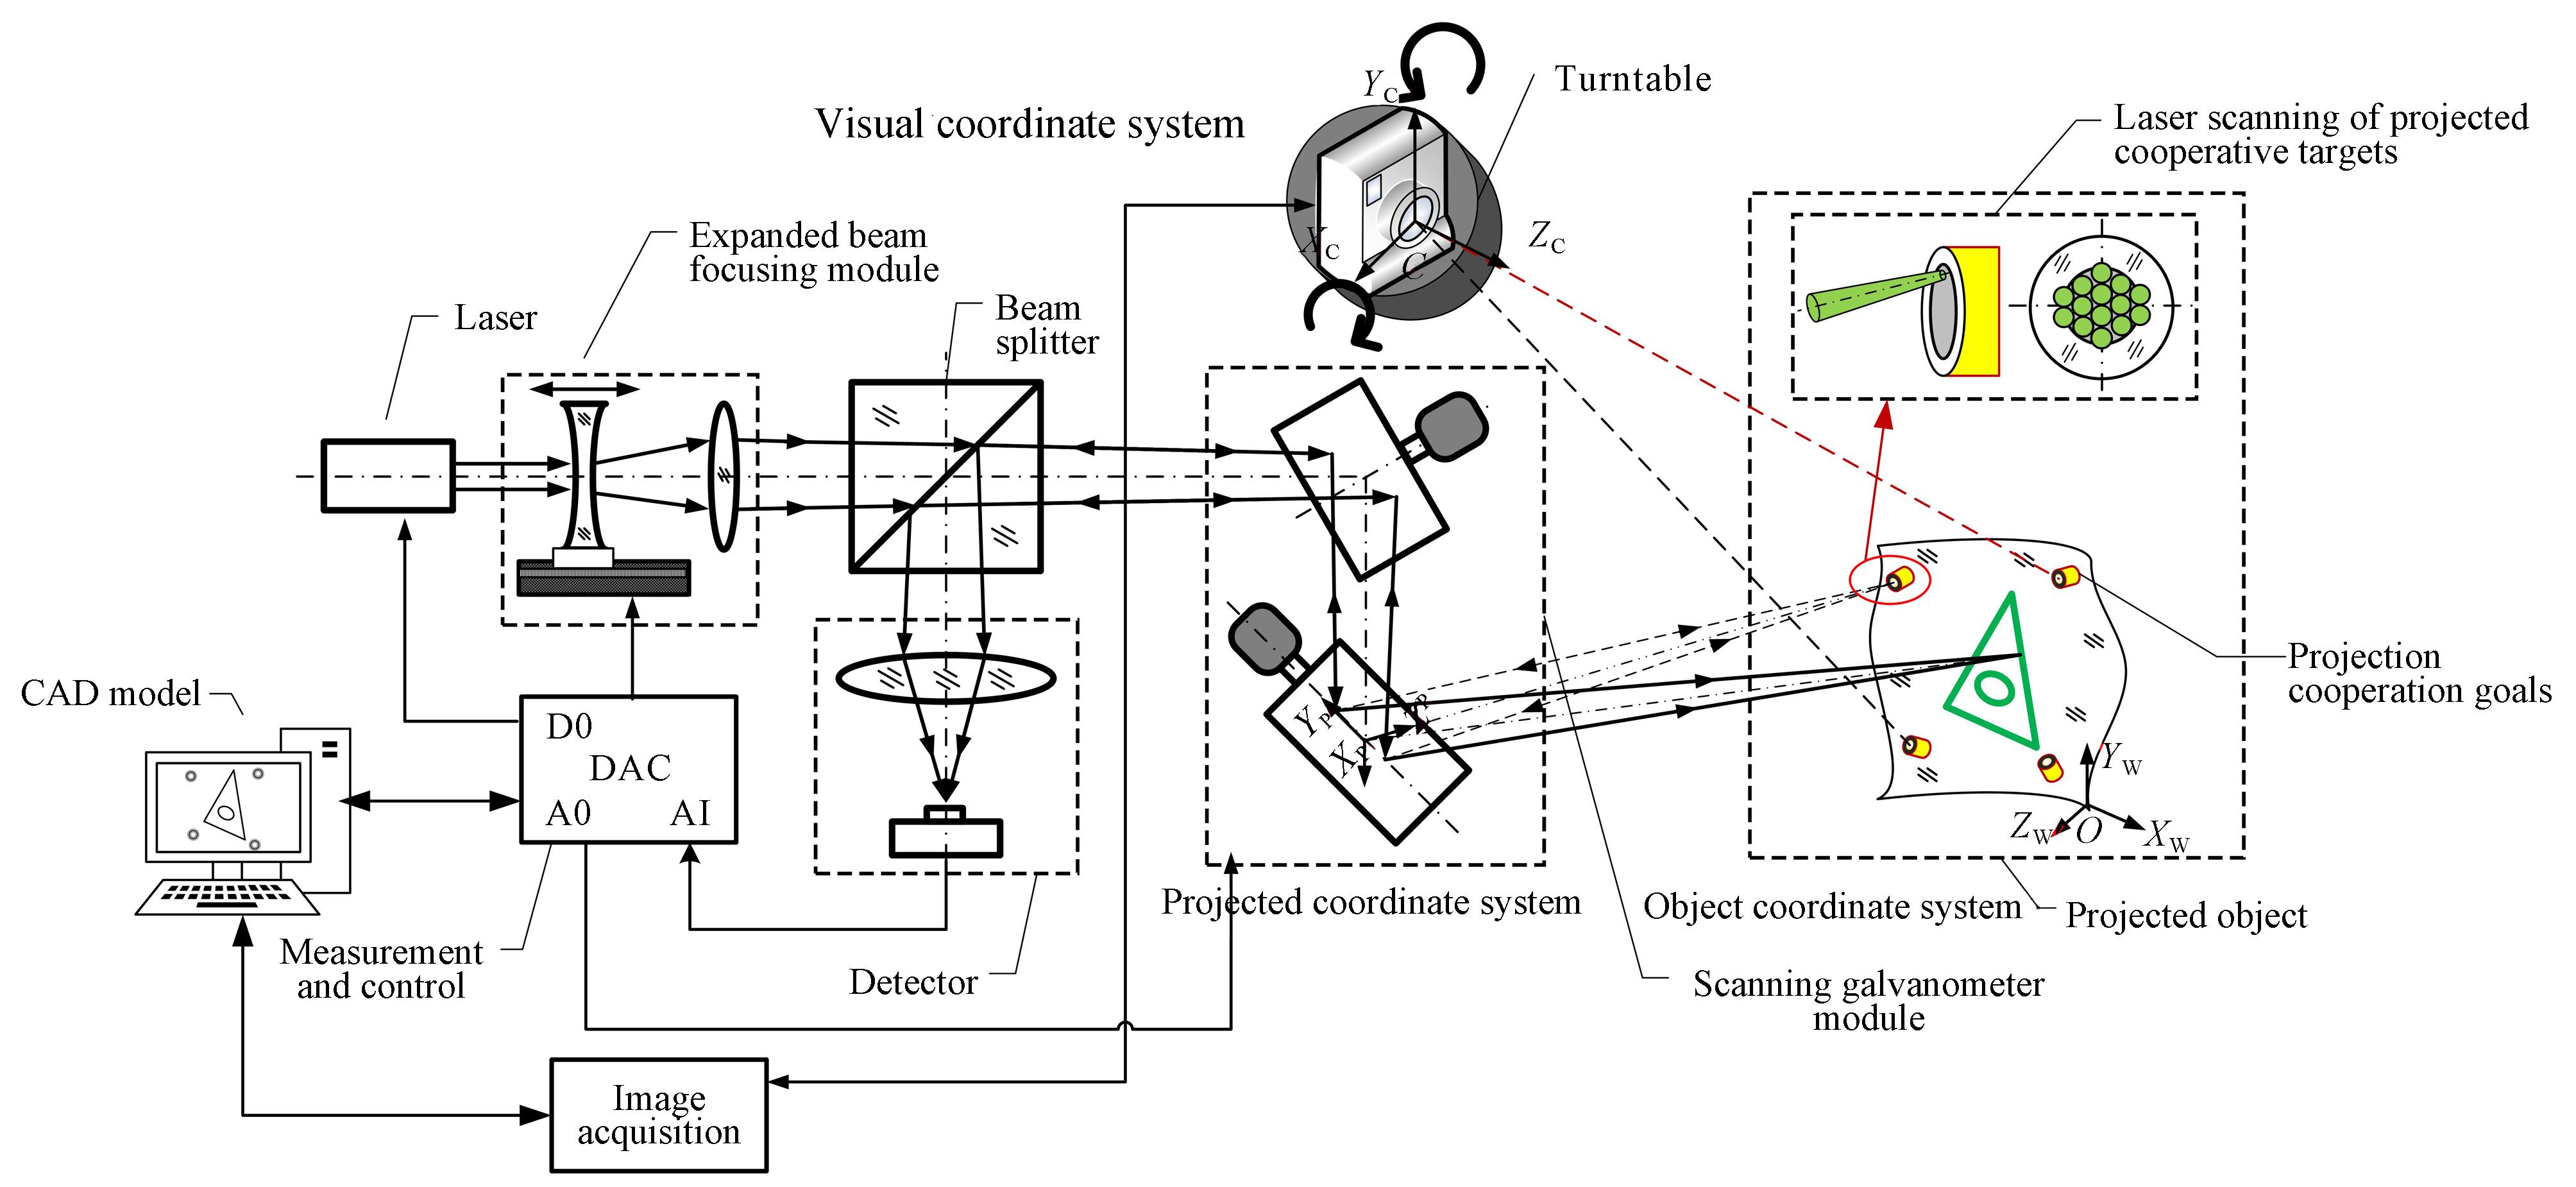
Fig. 1. Schematic diagram of the new laser scanning projection system
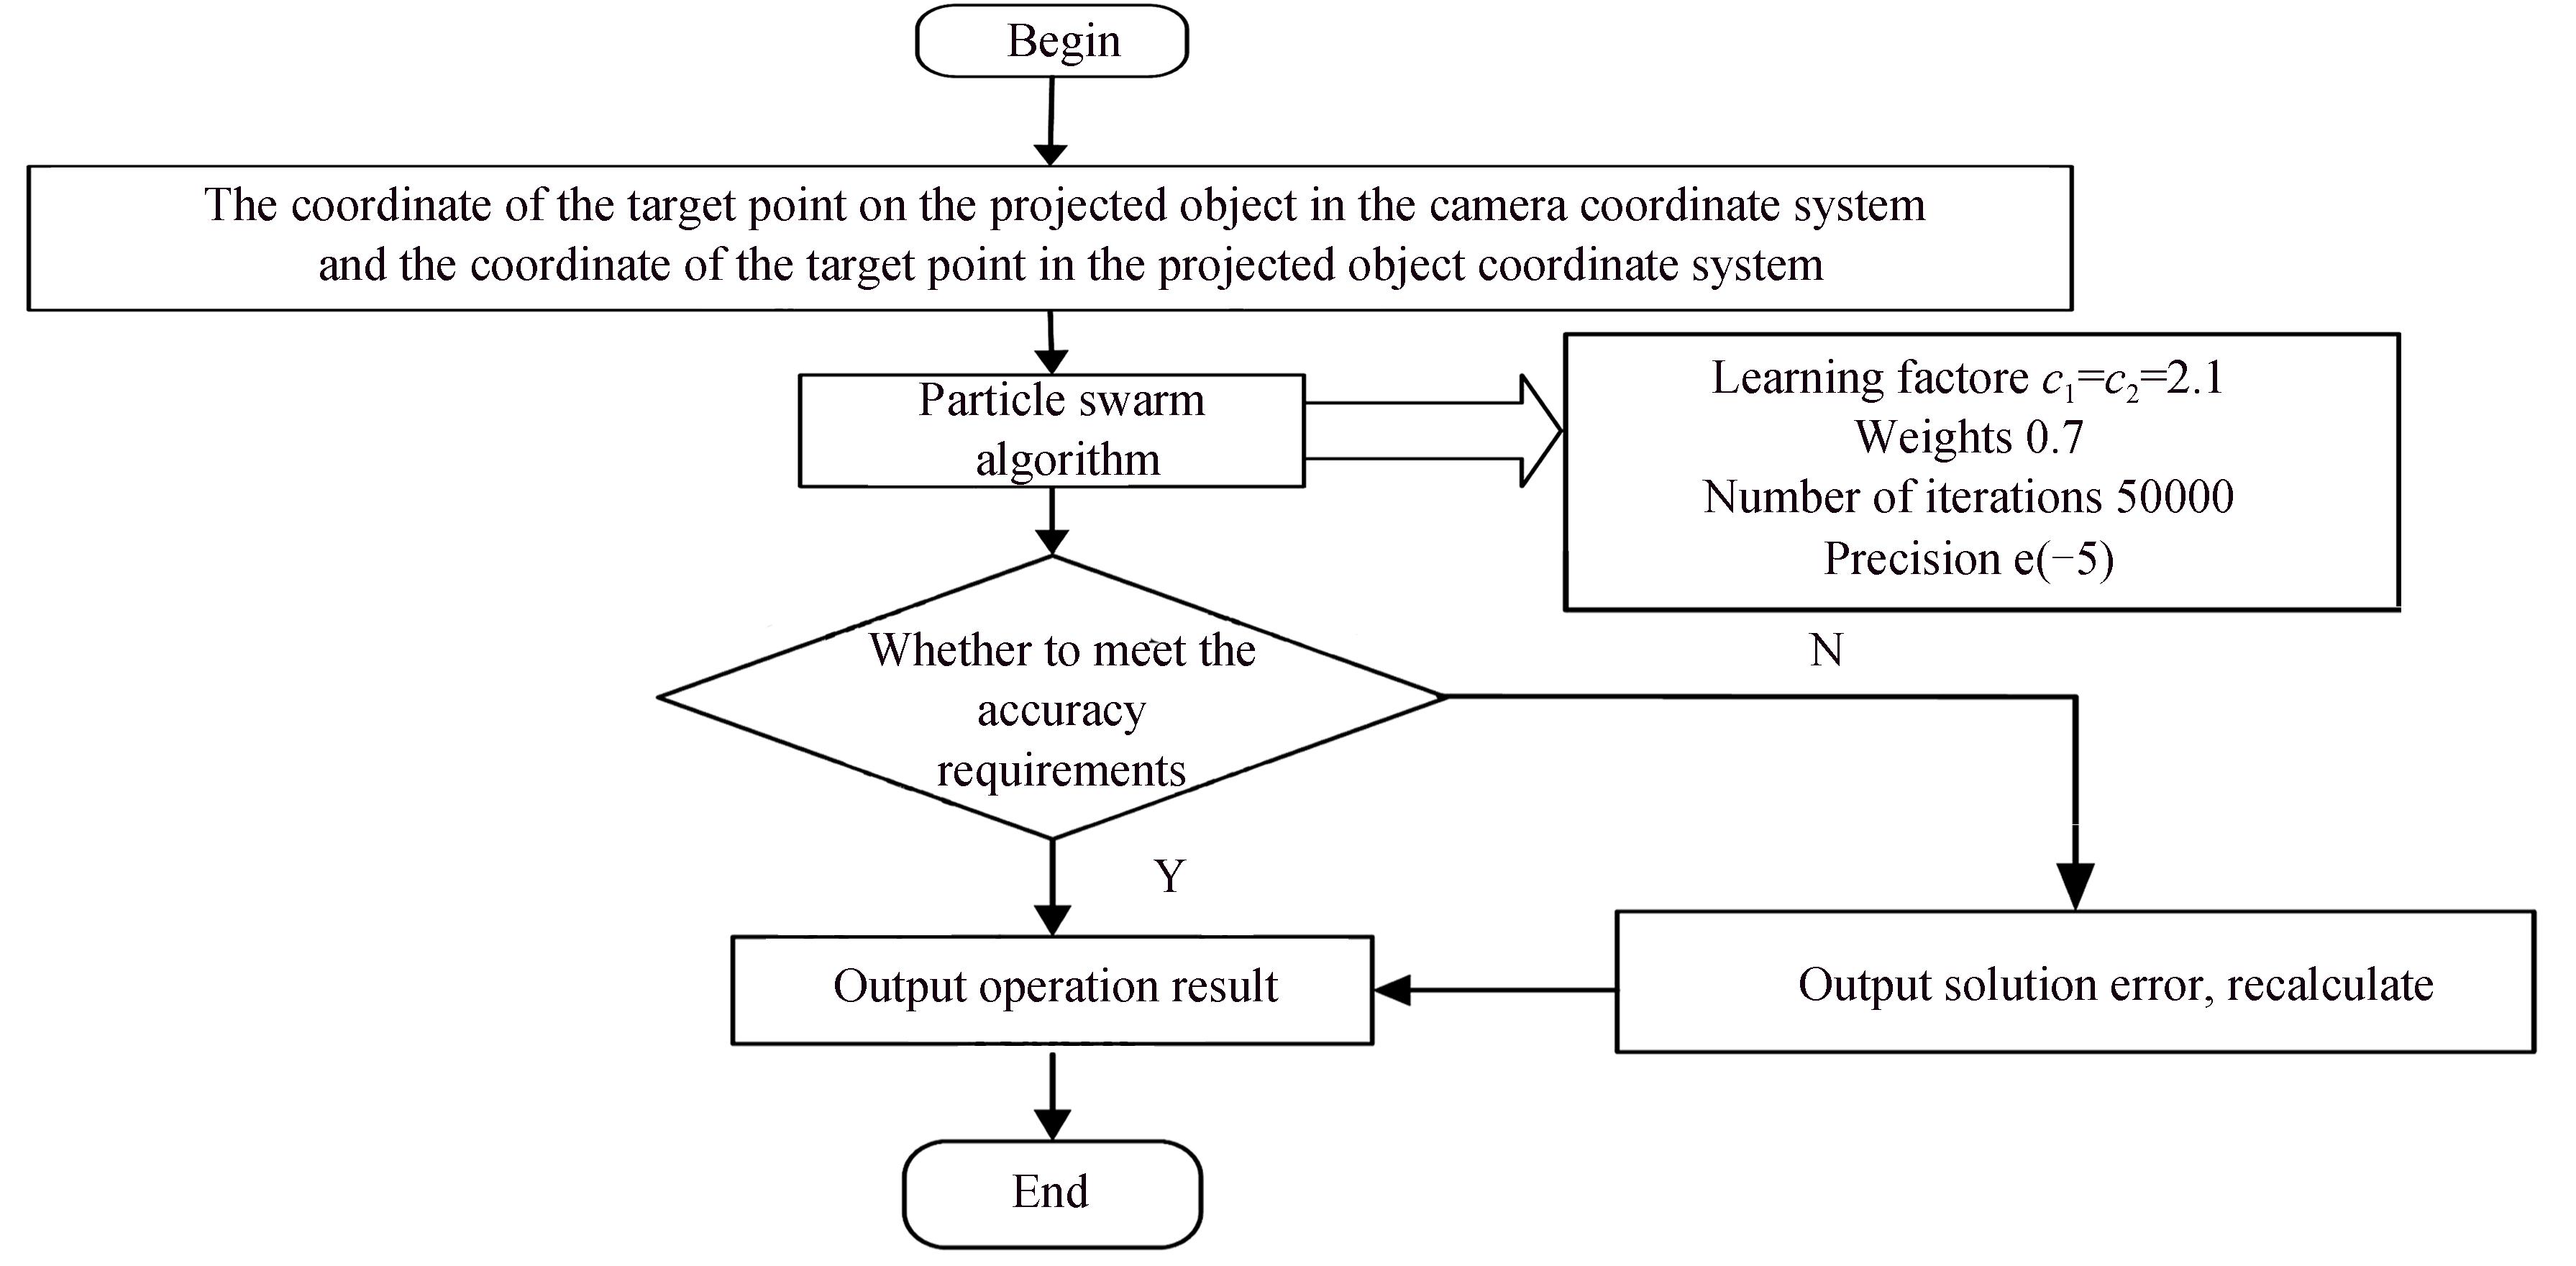
Fig. 2. The particle swarm algorithm solves the flow chart of the coordinate conversion relationship between the monocular camera and the projected object
Fig. 3. Errors of the translation matrix when the monocular camera rotates at different angles
Fig. 4. The error of the rotation matrix of the monocular camera rotating at different angles
Fig. 5. Angular error within the range of 1.5~3 meters offset
Fig. 6. Error graph of translation matrix of monocular camera at different distances
Fig. 7. Error of rotation matrix of monocular camera at different distances
Fig. 8. New laser scanning projection experiment system
| |||||||||||||||||||||||||
Table 1. Part of the experimental data
|
Table 2. Errors of the translation matrix when the monocular camera rotates at different angles
|
Table 3. Errors of the rotation matrix of the monocular camera at different angles
|
Table 4. Error of translation matrix of monocular camera at different distances
|
Table 5. Rotation matrix errors of monocular cameras at different distances
|
Table 6. The relationship between the moving distance of the monocular camera and the optimal rotation angle
| ||||||||||||||||||||||||
Table 7. Experimental data of laser scanning projection system and new laser scanning projection system

Set citation alerts for the article
Please enter your email address
© Copyright 2018-2021 | Chinese Laser Press. All Rights Reserved 沪ICP备15018463号-20