• Chinese Optics Letters
  • Vol. 20, Issue 11, 113901 (2022)
Xin Zhang1, Tao Pu1、*, Yunshan Zhang2, Hua Zhou1, Lin Lu1, Jin Li1, Xiangfei Chen3, and Jilin Zheng1、**
Author Affiliations
  • 1College of Communications Engineering, Army Engineering University of PLA, Nanjing 210007, China
  • 2School of Optoelectronic Engineering, Nanjing University of Posts and Telecommunications, Nanjing 210023, China
  • 3Microwave-Photonics Technology Laboratory, National Laboratory of Microstructures & College of Engineering and Applied Sciences, Nanjing University, Nanjing 210093, China
  • show less
    DOI: 10.3788/COL202220.113901 Cite this Article Set citation alerts
    Xin Zhang, Tao Pu, Yunshan Zhang, Hua Zhou, Lin Lu, Jin Li, Xiangfei Chen, Jilin Zheng. Weak RF signal detection with high resolution and no blind zone based on ultra-simple multi-mode optoelectronic oscillation[J]. Chinese Optics Letters, 2022, 20(11): 113901 Copy Citation Text show less
    Schematic diagram of the proposed RF signal detection (EDFA, erbium-doped fiber amplifier; SMF, single mode fiber; OTDL, optical tunable delay line; PD, photodetector; EC, electrical coupler; ES, electrical splitter; ESA, electrical spectrum analyzer).
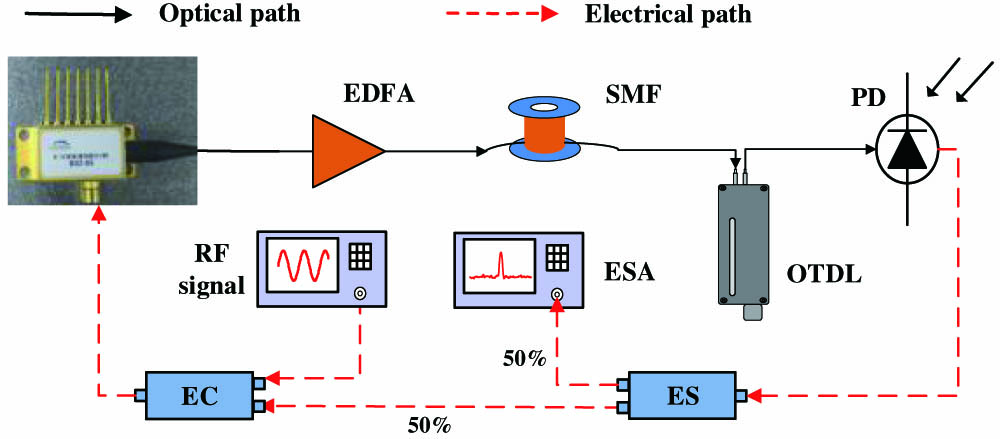
    Fig. 1. Schematic diagram of the proposed RF signal detection (EDFA, erbium-doped fiber amplifier; SMF, single mode fiber; OTDL, optical tunable delay line; PD, photodetector; EC, electrical coupler; ES, electrical splitter; ESA, electrical spectrum analyzer).
    Illustration of the RF signal detection. (a) Modulation response of the laser with a relaxation oscillation at fm. (b) Optical signal from the DFB laser after modulation. (c) Multi-mode oscillation state around fm after closing the loop when there is no input RF signal. (d) The RF signal fm is amplified when it matches with the oscillation mode. (e) The RF signal fm′ has loss when it mismatches with the oscillation mode. (f) The RF signal fm′ is amplified after tuning the delay time of the OTDL.
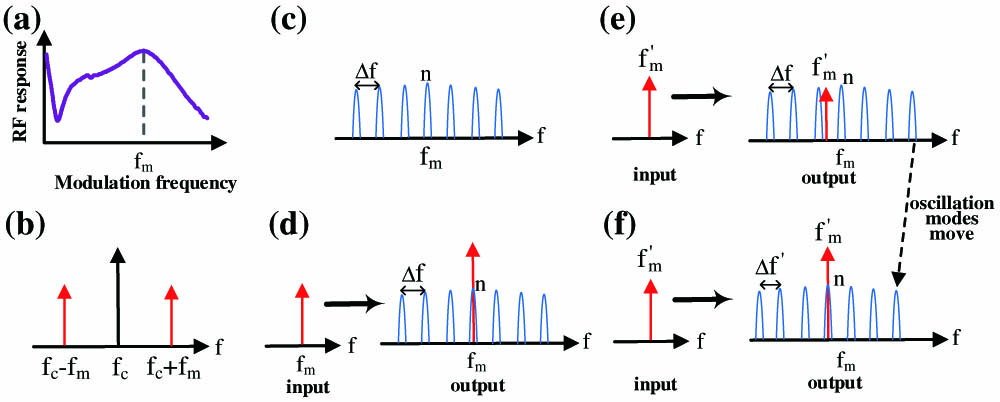
    Fig. 2. Illustration of the RF signal detection. (a) Modulation response of the laser with a relaxation oscillation at fm. (b) Optical signal from the DFB laser after modulation. (c) Multi-mode oscillation state around fm after closing the loop when there is no input RF signal. (d) The RF signal fm is amplified when it matches with the oscillation mode. (e) The RF signal fm has loss when it mismatches with the oscillation mode. (f) The RF signal fm is amplified after tuning the delay time of the OTDL.
    Simulation for the max Gsys with Gopen.
    Fig. 3. Simulation for the max Gsys with Gopen.
    Noise power with different photocurrents.
    Fig. 4. Noise power with different photocurrents.
    Sidemode power at different frequencies.
    Fig. 5. Sidemode power at different frequencies.
    Electrical spectra of the output RF signal: (a) span is 2 GHz, (b) span is 500 kHz.
    Fig. 6. Electrical spectra of the output RF signal: (a) span is 2 GHz, (b) span is 500 kHz.
    RF signals at different frequencies are amplified.
    Fig. 7. RF signals at different frequencies are amplified.
    Electrical spectra at 2.61825 GHz when the delay time is different.
    Fig. 8. Electrical spectra at 2.61825 GHz when the delay time is different.
    Electrical spectra of the detected RF signal at different frequencies with corresponding delay time when acquiring the max gain.
    Fig. 9. Electrical spectra of the detected RF signal at different frequencies with corresponding delay time when acquiring the max gain.
    Electrical spectra of the detected signals at 2.618255 GHz with different input power.
    Fig. 10. Electrical spectra of the detected signals at 2.618255 GHz with different input power.
    Stability of the detected signal. (a) 4.499963 GHz signal with different power. (b) Power fluctuation of the signal with −75 dBm at different frequencies.
    Fig. 11. Stability of the detected signal. (a) 4.499963 GHz signal with different power. (b) Power fluctuation of the signal with −75 dBm at different frequencies.
    QPSK constellation with different modulation rates at the power of −75 dBm with the center frequency of 2.618255 GHz.
    Fig. 12. QPSK constellation with different modulation rates at the power of −75 dBm with the center frequency of 2.618255 GHz.
    Xin Zhang, Tao Pu, Yunshan Zhang, Hua Zhou, Lin Lu, Jin Li, Xiangfei Chen, Jilin Zheng. Weak RF signal detection with high resolution and no blind zone based on ultra-simple multi-mode optoelectronic oscillation[J]. Chinese Optics Letters, 2022, 20(11): 113901
    Download Citation