
Xin Zhang, Tao Pu, Yunshan Zhang, Hua Zhou, Lin Lu, Jin Li, Xiangfei Chen, Jilin Zheng, "Weak RF signal detection with high resolution and no blind zone based on ultra-simple multi-mode optoelectronic oscillation," Chin. Opt. Lett. 20, 113901 (2022)
- Chinese Optics Letters
- Vol. 20, Issue 11, 113901 (2022)
Abstract
1. Introduction
Low-power radio frequency (RF) signal detection plays an important role in many applications[
In this paper, an ultra-simple method of weak RF signal detection with high resolution and no blind zone is proposed based on the multi-mode OEO. The OEO is realized utilizing the high modulation efficiency at the relaxation oscillation peak of the distributed feedback (DFB) semiconductor laser, which avoids using the optical modulator with high sensitivity. The characteristics such as gain for RF signal, resolution, noise floor, and sensitivity of the system based on the directly modulated multi-mode OEO are firstly analyzed. The resolution of the system is as high as 180 kHz. The unknown weak RF signal can be determined by adjusting the bias current and the optical tunable delay line (OTDL) to make the oscillation modes match with the RF signal. So, there is no blind zone within 1–4.5 GHz. The maximum gain provided for the signal is 17.88 dB, the sensitivity reaches up to
2. Principle and Experimental Setup
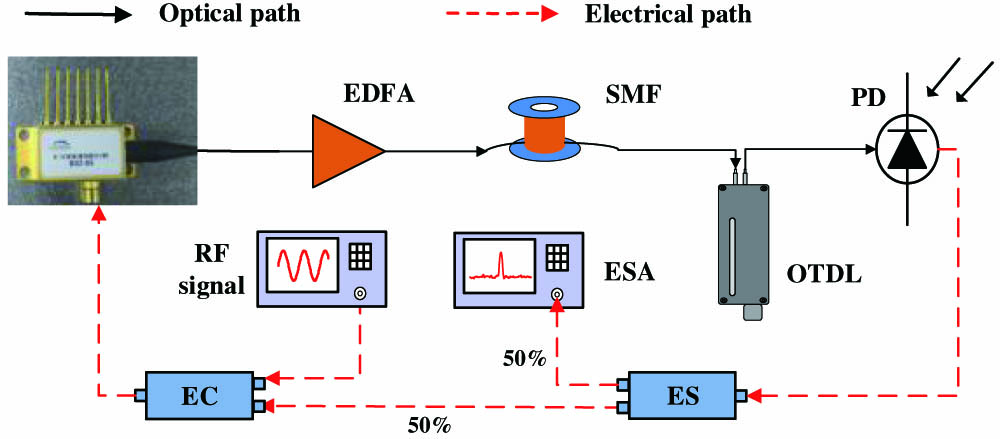
The RF detection system is set up according to the structure shown in Fig. 1. The optical signal is generated from a DFB semiconductor laser. It is amplified by the erbium-doped fiber amplifier (EDFA), which provides gain to compensate the loop loss. After transmitting through the 1.1 km single mode fiber (SMF), the optical carrier is sent to the OTDL (KG-ODL-15-PMF-10) with the max delay time of 400 ps, which is used to adjust the optical path length. The optical signal converts to electrical signal on the photodetector (PD, responsivity: 0.85 A/W). Then, the electrical signal will be sent to the RF port of the laser through the 5:5 electrical splitter (ES) and 5:5 electrical coupler (EC) to directly modulate the DFB laser. Thus, the optoelectronic oscillation loop is formed. The RF signal generated by the microwave signal generator is injected to the system through the ES. The output RF signal is monitored by the electrical signal analyzer (ESA).
Sign up for Chinese Optics Letters TOC. Get the latest issue of Chinese Optics Letters delivered right to you!Sign up now
![]()
Figure 1.Schematic diagram of the proposed RF signal detection (EDFA, erbium-doped fiber amplifier; SMF, single mode fiber; OTDL, optical tunable delay line; PD, photodetector; EC, electrical coupler; ES, electrical splitter; ESA, electrical spectrum analyzer).
Thanks to the directly modulated OEO, the RF signal located at relaxation oscillation frequency
![]()
Figure 2.Illustration of the RF signal detection. (a) Modulation response of the laser with a relaxation oscillation at fm. (b) Optical signal from the DFB laser after modulation. (c) Multi-mode oscillation state around fm after closing the loop when there is no input RF signal. (d) The RF signal fm is amplified when it matches with the oscillation mode. (e) The RF signal fm′ has loss when it mismatches with the oscillation mode. (f) The RF signal fm′ is amplified after tuning the delay time of the OTDL.
The open loop gain is obtained in Eq. (6), which is proportional to
The single mode RF signal can be obtained by directly modulating the DFB laser based on OEO as long as the open loop gain is high enough[
So, the system can realize the RF signal detection without a blind zone within the detection bandwidth.
2.1. Gain property of the detection system
In the OEO loop, the total field is the summation of all circulating fields[
When the RF signal is located at the relaxation oscillation frequency, it will obtain the max
![]()
Figure 3.Simulation for the max Gsys with Gopen.
2.2. Noise performance and detection sensitivity
The detection sensitivity is defined as the minimum detectable input RF power, which is determined by the oscillation modes of the OEO. The power of the oscillation modes is determined by the noise power and gain. In the conventional OEO loop, the total noise is composed of shot noise, thermal noise, and the laser’s relative intensity noise (RIN). In this system, the EDFA will introduce amplifier spontaneous emission (ASE) noise. So, the beat noise between the signal and ASE (S-ASE) as well as the beat noise between ASE and ASE (ASE-ASE) should be taken into account.
The power of the thermal noise can be expressed as
A simulation for the noise power of the open loop system with different output current
![]()
Figure 4.Noise power with different photocurrents.
According to the loop oscillation theory[
Set
![]()
Figure 5.Sidemode power at different frequencies.
From Eqs. (10) and (18), it can be seen that, with the open loop gain increasing, the system gain for the RF signal will increase, and the detection sensitivity will be improved.
3. Results and Discussion
3.1. Gain property based on OEO
The RF detection system is set up based on the structure shown in Fig. 1. Once the bias current of the laser is fixed, only the signal aligned with the oscillation frequency can get the maximum gain. We set the bias current at 10 mA (threshold current is 8 mA) and adjust the open loop gain to make the system work at the multi-mode oscillation state, as shown in Fig. 6. In Fig. 6(a), the span is 2 GHz. The inset is the spectrum when no RF signal is injected into the system. The power of the oscillation modes is not equal, and the trend is basically the same as the modulation response of the DFB laser at a certain bias current, as shown in Fig. 5. The experimental results are consistent with the simulation results. Set the power of input RF signals (
![]()
Figure 6.Electrical spectra of the output RF signal: (a) span is 2 GHz, (b) span is 500 kHz.
For the RF signal at different frequencies, the amplification property is also investigated. At first, the delay time of the OTDL is set at 0 ps. According to the principle, the RF signal, which matches the oscillation mode located at the relaxation oscillation frequency, will get the largest gain. By adjusting the bias current of the laser, the relaxation oscillation frequency will change accordingly. Thus, amplifying the RF signal at different frequencies is realized. When the bias current changes from 8 mA to 12 mA, the RF signal acquires amplification within 1–4.5 GHz, as shown in Fig. 7. During the detection range, the power of the output RF signal is above
![]()
Figure 7.RF signals at different frequencies are amplified.
3.2. No blind zone during the detection range
When the loop length is fixed, the interval between the oscillation modes is determined, and the system cannot provide gain for the RF signals, which mismatches with the oscillation modes. The problem can be solved by adjusting the delay time of the OTDL, which changes the loop length slightly. At first, the RF signal at 2.61825 GHz with
![]()
Figure 8.Electrical spectra at 2.61825 GHz when the delay time is different.
![]()
Figure 9.Electrical spectra of the detected RF signal at different frequencies with corresponding delay time when acquiring the max gain.
3.3. Sensitivity, gain dynamic range, and stability
The sensitivity is defined as the detectable input RF power, which is an important parameter for the system. The RF signal with the frequency of 2.618255 GHz is injected to the system. The input RF power is decreased from
![]()
Figure 10.Electrical spectra of the detected signals at 2.618255 GHz with different input power.
On the other hand, the gain dynamic range property is also investigated, which is defined as the difference between the sensitivity and the highest input power when it equals the output power. Increasing the input power from
Next, we research the stability of the system for the RF signal with different power. The frequency of the RF signal is set at 4.499963 GHz. In Fig. 11(a), using the “max hold” function of the ESA to mark the maximum power and “min hold” function to mark the minimum power of the signal, they are represented by solid lines and dotted lines, respectively. With the RF power increasing from
![]()
Figure 11.Stability of the detected signal. (a) 4.499963 GHz signal with different power. (b) Power fluctuation of the signal with −75 dBm at different frequencies.
Finally, the detection performance for the modulated RF signal is investigated. The 2.618255 GHz RF signal with 2.4, 4.8, 10, and 20 ksps quadrature phase-shift keying (QPSK) data is applied to the system. The RF power is fixed at
![]()
Figure 12.QPSK constellation with different modulation rates at the power of −75 dBm with the center frequency of 2.618255 GHz.
4. Conclusion
To conclude, in this paper, a simple method to realize weak RF signal detection with high sensitivity and no blind zone within the detection range is proposed and experimentally demonstrated. The system is based on the multi-mode OEO, which is realized by directly modulating the DFB semiconductor laser at the relaxation oscillation. The highly sensitive optical modulator and narrow band optical filter are avoided to make the system with low cost. The gain provided by the EDFA not only compensates the loss in the loop, but also makes the system work at the multi-mode oscillation state. The characteristics of the directly modulated detection system are analyzed for the first time, to the best of our knowledge. The experimental results are consistent with the simulation results. The RF signal aligning with the original oscillation modes can be amplified. By simply tuning the bias current of the laser, the system can detect RF signals from 1 to 4.5 GHz. Furthermore, by adjusting the delay time of the OTDL, the oscillation modes can move to search for and match with the unknown RF signal that mismatches with the original modes. So, there is no blind zone within 1–4.5 GHz. It provides the maximum gain of 17.88 dB for RF signals, and the sensitivity is as high as
References
[1] P. Ghelfi, F. Laghezza, F. Scotti, G. Serafino, A. Capria, S. Pinna, D. Onori, C. Porzi, M. Scaffardi, A. Alacarne, V. Vercesi, E. Lazzeri, F. Berizzi, A. Bogoni. A fully photonics-based coherent radar system. Nature, 507, 341(2014).
[2] J. Raza, A.-J. Boonstra, A. J. van der Veen. Spatial filtering of RF interference in radio astronomy. IEEE Signal Process. Lett., 9, 64(2002).
[3] C. Wang, F. Haider, X. Gao, X. You, Y. Yang, D. Yuan, H. M. Aggoune, H. Haas, S. Fletcher, E. Hepsaydir. Cellular architecture and key technologies for 5G wireless communication networks. IEEE Commun. Mag., 52, 122(2014).
[4] G. W. Anderson, D. C. Webb, A. E. Spezio, J. N. Lee. Advanced channelization for RF, microwave, and millimeter wave applications. Proc. IEEE, 79, 355(1991).
[5] T. S. Rappaport, S. Sun, R. Mayzus, H. Zhao, Y. Azar, K. Wang, G. N. Wong, J. K. Schulz, M. Samimi, F. Gutierrez. Millimeter wave mobile communications for 5G cellular: it will work!. IEEE Access, 1, 335(2013).
[6] D. Cabric, S. M. Mishra, R. W. Brodersen. Implementation issues in spectrum sensing for cognitive radios. Conference on Signals, Systems and Computers, IEEE Pacific Grove, 772(2004).
[7] P. S. Devgan, M. W. Pruessner, V. J. Urick, K. J. Williams. Detecting low-power RF signals using a multimode optoelectronic oscillator and integrated optical filter. IEEE Photon. Tech. Lett., 22, 152(2010).
[8] Y. Shao, X. Han, M. Li, M. Zhao. RF signal detection by a tunable optoelectronic oscillator based on a PS-FBG. Opt. Lett., 43, 1199(2018).
[9] G. Wang, T. Hao, W. Li, N. Zhu, M. Li. Detection of wideband low-power RF signals using a stimulated Brillouin scattering-based optoelectronic oscillator. Opt. Commun., 439, 133(2019).
[10] X. Zhang, T. Pu, Y. Zhang, H. Zhou, J. Li, H. Zhu, X. Chen, J. Zheng. Ultra simple low-power RF signal detection based on an optoelectronic feedback DFB laser. Opt. Express, 29, 29641(2021).
[11] J. Xiong, R. Wang, T. Fang, T. Pu, D. Chen, L. Lu, P. Xiang, J. Zheng, J. Zhao. Low-cost and wideband frequency tunable optoelectronic oscillator based on a directly modulated distributed feedback semiconductor laser. Opt. Lett., 38, 4128(2013).
[12] X. S. Yao, L. Maleki. Optoelectronic microwave oscillator. J. Opt. Soc. Am. B., 13, 1725(1996).
[13] B. Qi, H. Wang, B. Zhang, L. Xie, P. Gong. Improvement of the phase noise model based on an optoelectronic oscillator using a directly modulated distributed feedback laser. Opt. Commun., 488, 126848(2021).
[14] Y. Shao, X. Han, Q. Ye, B. Zhu, Y. Dai, C. Wang, M. Zhao. Low-power RF signal detection using a high-gain tunable OEO based on equivalent phase modulation. J. Lightwave. Technol., 37, 5370(2019).


Set citation alerts for the article
Please enter your email address

© Copyright 2018-2021 | Chinese Laser Press. All Rights Reserved 沪ICP备15018463号-20