• Acta Optica Sinica
  • Vol. 42, Issue 9, 0930003 (2022)
Peng Chen1, Chao Qi2, Renwei Liu1, Zhenzhen Wang1、3、*, Han Luo1, Junjie Yan1、3, Jiping Liu1, and Yoshihiro Deguchi1、3
Author Affiliations
  • 1School of Energy and Power Engineering, Xi′an Jiaotong University, Xi′an 710049, Shaanxi, China
  • 2Xi′an Aerospace Propulsion Institute, Xi′an 710100, Shaanxi, China
  • 3Graduate School of Technology, Industrial and Social Sciences, Tokushima University, Tokushima 770- 8506, Japan
  • show less
    DOI: 10.3788/AOS202242.0930003 Cite this Article Set citation alerts
    Peng Chen, Chao Qi, Renwei Liu, Zhenzhen Wang, Han Luo, Junjie Yan, Jiping Liu, Yoshihiro Deguchi. Quantitative Analysis of Carbon Content in Fly Ash Using LIBS Based on Support Vector Machine Regression[J]. Acta Optica Sinica, 2022, 42(9): 0930003 Copy Citation Text show less
    Schematic of LIBS experimental system
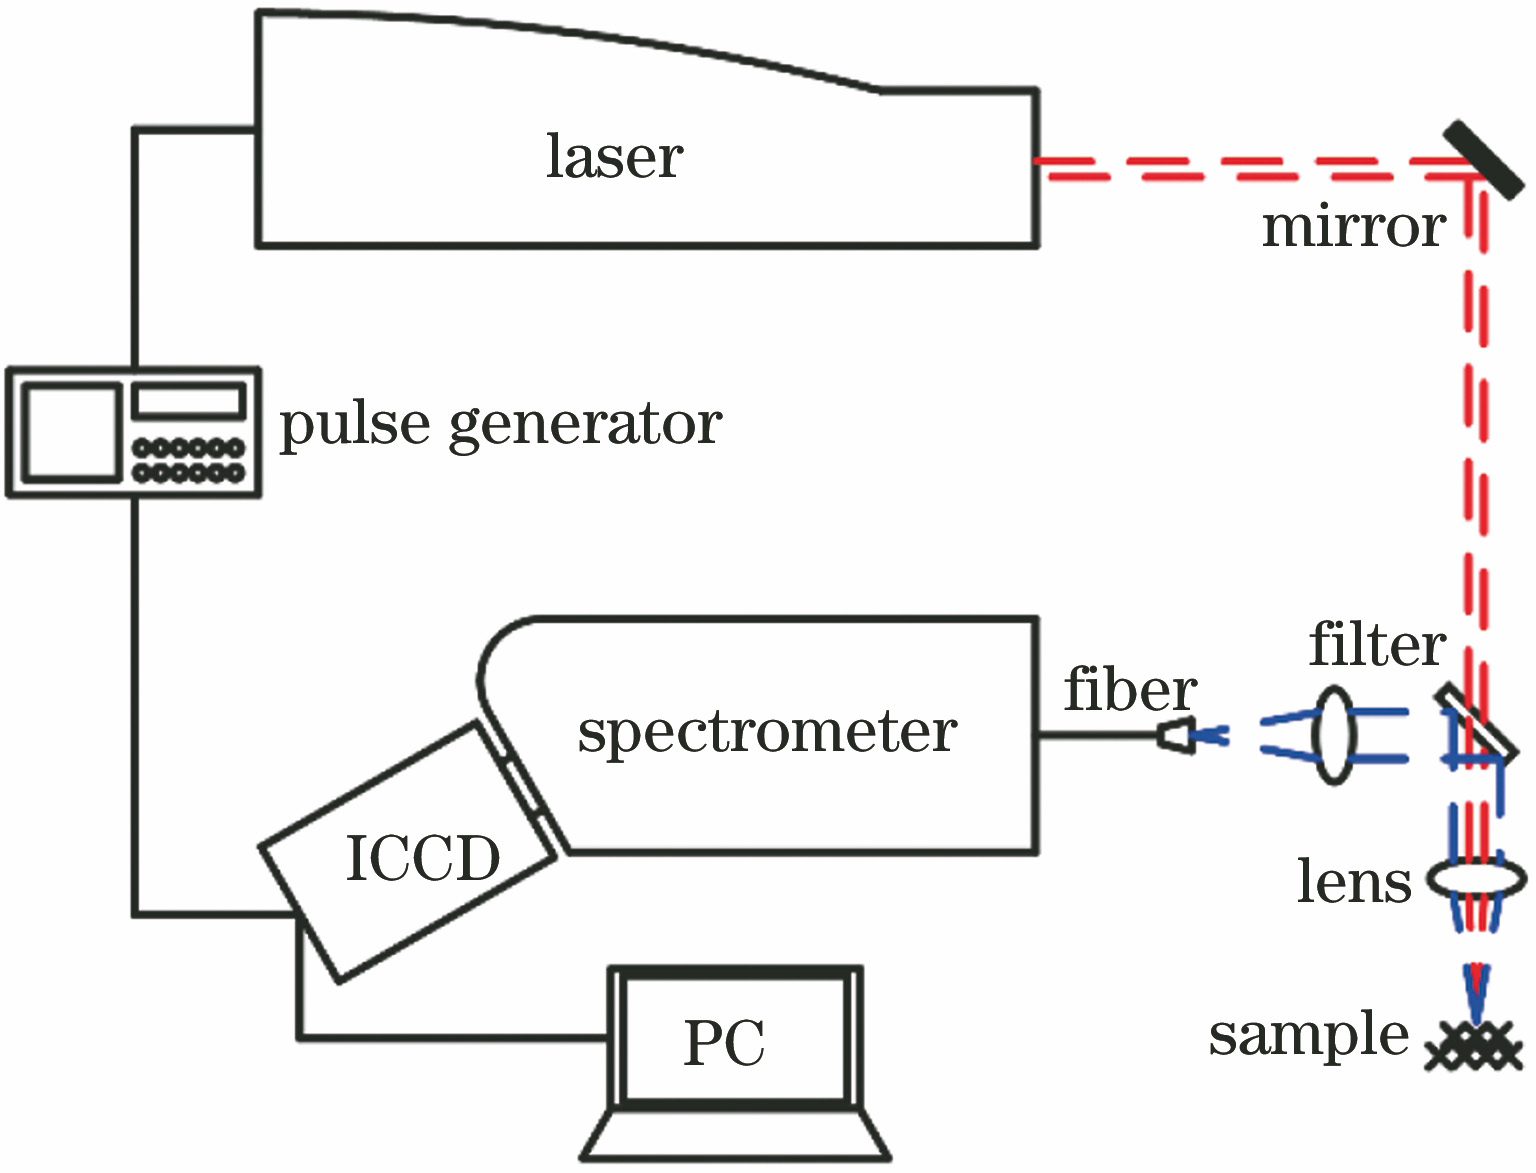
    Fig. 1. Schematic of LIBS experimental system
    LIBS spectra of sample GD_0 at different resolutions. (a) Resolution is 0.075 nm/pixel; (b) resolution is 0.012 nm/pixel
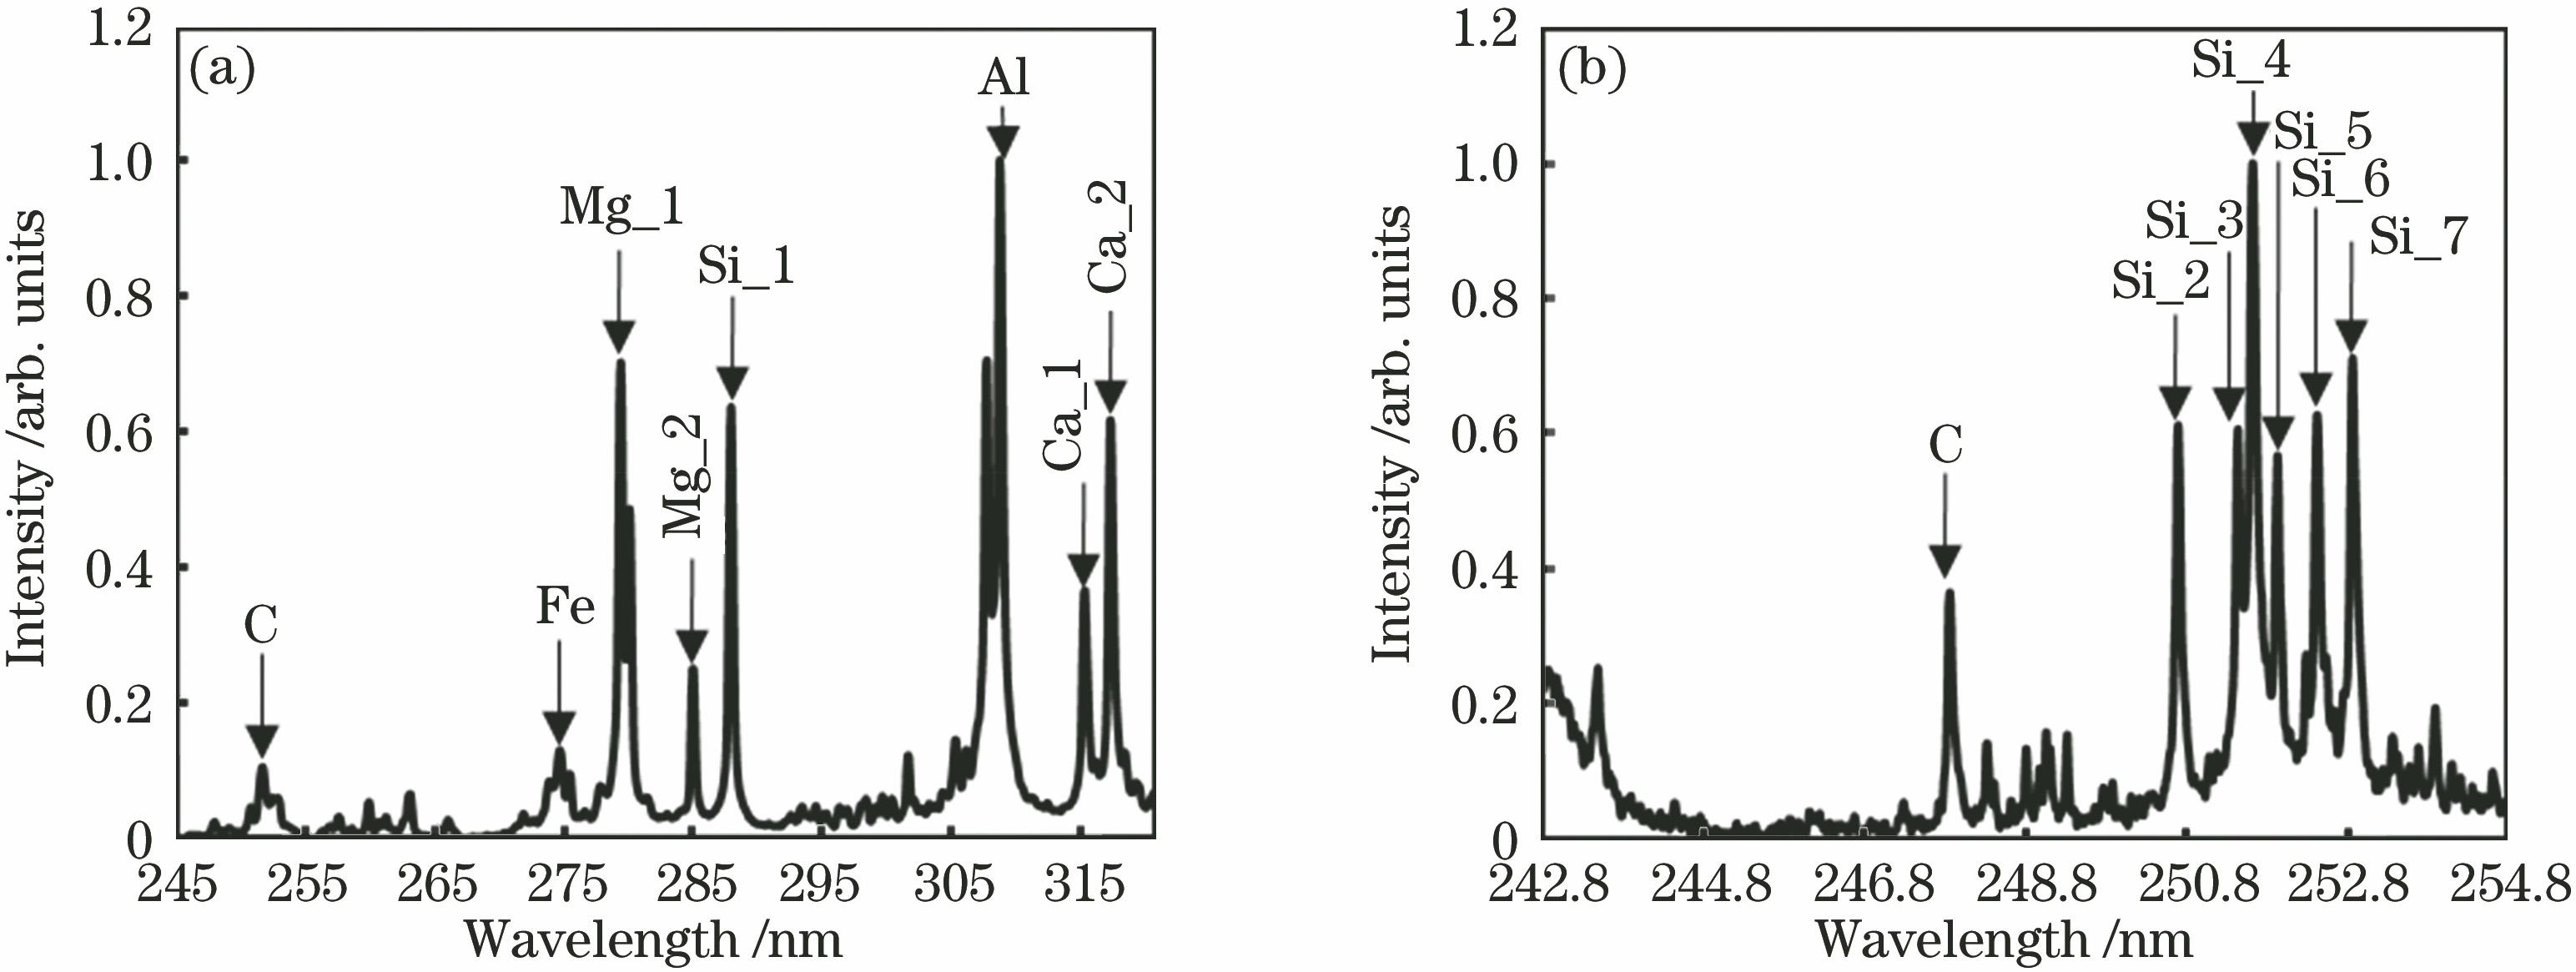
    Fig. 2. LIBS spectra of sample GD_0 at different resolutions. (a) Resolution is 0.075 nm/pixel; (b) resolution is 0.012 nm/pixel
    Calibration curves of carbon content in fly ash under different methods. (a) Traditional calibration method; (b) internal standard method
    Fig. 3. Calibration curves of carbon content in fly ash under different methods. (a) Traditional calibration method; (b) internal standard method
    Effects of c and g on MSE. (a) Training results of RBF kernel function; (b) training results of polynomial kernel function
    Fig. 4. Effects of c and g on MSE. (a) Training results of RBF kernel function; (b) training results of polynomial kernel function
    Quantitative analysis of carbon content based on characteristic spectra of internal standard elements
    Fig. 5. Quantitative analysis of carbon content based on characteristic spectra of internal standard elements
    Quantitative analysis of carbon content based on full spectrum
    Fig. 6. Quantitative analysis of carbon content based on full spectrum
    Quantitative analysis of carbon content based on characteristic spectra of major elements
    Fig. 7. Quantitative analysis of carbon content based on characteristic spectra of major elements
    SamplenumberLabelC contentyC /%SamplenumberLabelC contentyC /%SamplenumberLabelC contentyC /%
    1GD_020.819GE_045.6417GY_034.60
    2GD_226.5410GE_248.7618GY_238.77
    3GD_534.0511GE_553.0119GY_544.35
    4GD_840.5212GE_856.8220GY_849.27
    5GD_1044.3513GE_1059.1421GY_1049.27
    6GD_1552.5914GE_1564.3222GY_1552.23
    7GD_2059.3415GE_2068.7423GY_2064.19
    8GD_3069.7016GE_3075.9324GY_3072.83
    Table 1. Carbon content of fly ash samples
    ElementIonizationWavelength W /nmUpper level Ei /cm-1Lower level Ek /cm-1
    CC I247.8621648.0361981.83
    Si_2Si I250.6977.1239955.05
    Si_3Si I251.43039760.28
    Si_4Si I251.61223.1639955.05
    Si_5Si I251.9277.1239760.28
    Si_6Si I252.4177.1239683.16
    Si_7Si I252.85223.1639760.28
    FeFe I & Fe II274.20--275.63415.93--8846.7036686.16--45289.80
    Mg_1Mg II279.55--280.30035760.88--35669.31
    Mg_2Mg I285.21035051.26
    Si_1Si I288.166298.8540991.88
    AlAl I309.27112.0632436.80
    Ca_1Ca II315.8925191.5156839.25
    Ca_2Ca II318.1325414.4056839.25
    Table 2. Information of main characteristic lines
    InputR2RMSEC /%RMSEP /%
    Iinput10.8606.215.66
    Whole spectra0.9600.035.72
    Iinput20.9861.792.57
    Table 3. Evaluation index of carbon content under three inputs
    Peng Chen, Chao Qi, Renwei Liu, Zhenzhen Wang, Han Luo, Junjie Yan, Jiping Liu, Yoshihiro Deguchi. Quantitative Analysis of Carbon Content in Fly Ash Using LIBS Based on Support Vector Machine Regression[J]. Acta Optica Sinica, 2022, 42(9): 0930003
    Download Citation