
Guangwei Meng, Jun She, Tianming Song, Jiamin Yang, Min Wang. Theoretical investigations on x-ray transport in radiation transport experiments on the Shenguang-III prototype laser facility[J]. Matter and Radiation at Extremes, 2022, 7(2): 025901
- Matter and Radiation at Extremes
- Vol. 7, Issue 2, 025901 (2022)
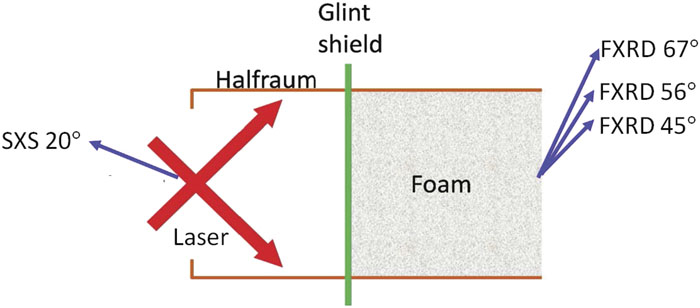
Fig. 1. Schematic of the targets for the experiments.
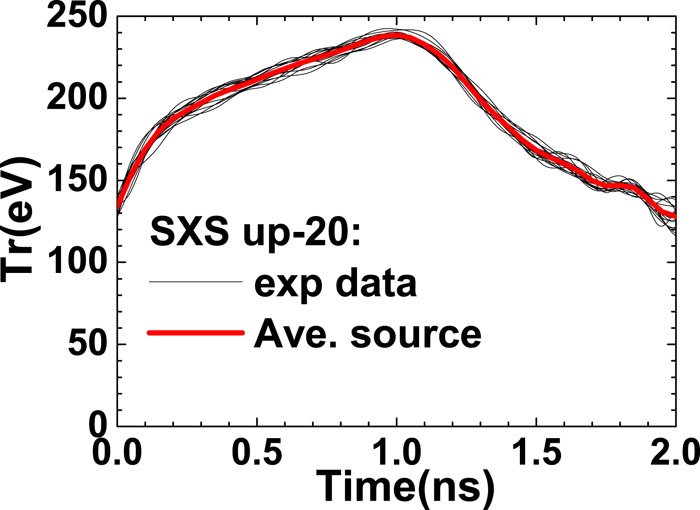
Fig. 2. Time profiles of T r at 20° relative to the halfraum axis. The black solid lines show time profiles of T r measured with the SXS from different shots. The red solid line shows the average T r of these shots.
Fig. 3. Comparison of the radiation fluxes out of the 1000 µ m [(a)–(c)] and 1500 µ m [(d)–(f)] foam cylinders at (a) and (d) 45°, (b) and (e) 56°, and (c) and (f) 67° between the measurements from different shots (shown in black) and simulated results derived from the original radiation source and Au material parameters (shown in red). The measurement errors of the time and fluxes are shown by the gray regions.
Fig. 4. Time profiles of the radiation fluxes emitted by the Au plasma (green solid line), CH plasma (red solid line), and the entire foam cylinder (blue solid line) at (a) 45°, (b) 56°, and (c) 67° for a 1000 µ m foam cylinder.
Fig. 5. Plots of (a) F max simu F max fit t half simu t half fit µ m (blue solid triangles) and 1500 µ m (black solid squares) foam cylinders. The function y = x that represents a perfect fit is shown in red. The green and cyan solid circles correspond to the testing simulations for the 1000 and 1500 µ m foam cylinders, respectively.
Fig. 6. Ranges of Au opacity and EOS scaling factors η op and η eos fixed by different experiments. The red band denotes the range of (η op, η eos) determined by F max, the green band denotes the range of (η op, η eos) determined by t half, the yellow band shows the range of (η op, η eos) fixed by our previous foam-confined plasma expansion experiment,12 and the blue band shows the range of (η op, η eos) fixed by an Au foil burnthrough experiment.21 The region of overlap of the four bands is marked by the white oval.
Fig. 7. Comparisons of the angular dependence of the peak fluxes out of the 1000 µ m (a) and 1500 µ m (b) foams between experiment (black solid squares) and simulations. The red dashed and solid lines show the simulated results calculated using the original and scaled Au material parameters, respectively.
Fig. 8. Comparisons of the radiation fluxes out of the 1000 µ m [(a)–(c)] and 1500 µ m [(d)–(f)] foam cylinders at (a) and (d) 45°, (b) and (e) 56°, and (c) and (f) 67° between simulations and measurements. The black solid lines show the time profiles of the radiation fluxes measured with FXRDs from different shots. The red and green solid lines show the results calculated using the original and scaled Au material parameters, respectively.
| ||||||||||||||||||||||||||||||||||||||||||||||||||||||||||||||||||||||||||||||||||||||||||||||
Table 1. Fitting coefficients for the peak radiation flux Fmax and the breakout time of the heat wave thalf of the 1000 and 1500 µm foam cylinders at 45°, 56°, and 67°.


Set citation alerts for the article
Please enter your email address

© Copyright 2018-2021 | Chinese Laser Press. All Rights Reserved 沪ICP备15018463号-20