
Guangwei Meng, Jun She, Tianming Song, Jiamin Yang, Min Wang. Theoretical investigations on x-ray transport in radiation transport experiments on the Shenguang-III prototype laser facility[J]. Matter and Radiation at Extremes, 2022, 7(2): 025901
- Matter and Radiation at Extremes
- Vol. 7, Issue 2, 025901 (2022)
Abstract
I. INTRODUCTION
Radiation transport is of crucial importance to high-energy-density physics (HEDP)1,2 and is a fundamental energy transport mechanism in inertial confinement fusion (ICF)3 and in many laboratory and astrophysical plasmas.4–8 In indirect drive ICF, a high-Z hohlraum is used to convert large amounts of laser energy into high-temperature x-rays, which are then absorbed by the ablator of a fusion capsule through radiation transport, with radiation hydrodynamic behavior ensuing. In the astrophysical field, many phenomena, such as radiative shocks9 and nebulae with dense, cool star-forming regions irradiated by nearby stars,10 are correlated with radiation transport.
Over recent decades, a number of theoretical11–15 and experimental16–21 investigations focusing on radiation transport have been conducted. From a theoretical aspect, Hammer and Rosen11 have developed a perturbation technique for solving the nonlinear radiation diffusion equation for both the supersonic and subsonic cases. Quantities of practical interest, such as the depth of heat front penetration and the absorbed heat flux, can be readily derived with their method. In our previous work,12 a theoretical method was proposed to verify the opacity and equation of state (EOS) of high-Z plasmas in rarefactive states, based on two independent experimental measurements, namely, the propagation of heat waves and hydrodynamic motion in radiation ablation processes. From an experimental aspect, Back et al.16 have performed experiments on low-density (40–50 mg/cm3) foams to study diffusive supersonic radiation transport, where the ratio of the diffusive radiation front velocity to the material sound speed exceeds 2, using the Omega laser facility. Guymer et al.17 have carried out supersonic diffusive radiation flow experiments on the National Ignition Facility (NIF), aiming at exploring the radiation flow through optically thick media from a strong radiation source.
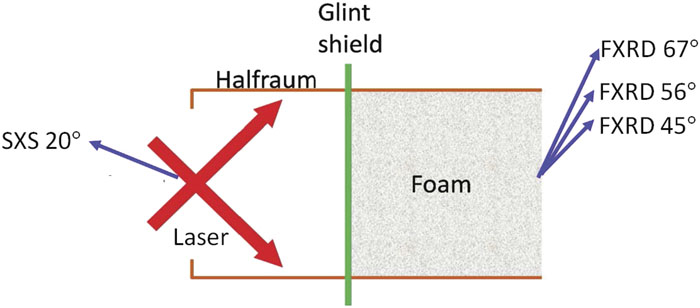
The propagation of heat waves within CH foam cylinders was explored experimentally on the Shenguang-III prototype laser facility in 2012. Compared with the experimental works in Refs. 16–21, the heat wave in the foam was nondiffusive in this experiment, and the foam became optically thin after it had been completely heated by the radiation. Furthermore, the radiation fluxes out of the CH foam were measured simultaneously at different angles in each shot, which gave a more detailed characterization of the radiation transport process in the foam. The experiment was designed to obtain accurate data on heat wave propagation, so that we could study the effect of the Au sleeve on the heat wave propagation and validate our two-dimensional (2D) radiation hydrodynamic code. A schematic of the targets for the experiments, consisting of a half-hohlraum (referred to as a “halfraum” in this paper), a glint shield, and a foam sample, is displayed in Fig. 1. In the experiments, the 800 µm long Au halfraum with a diameter of 1000 µm was illuminated through a laser entrance hole (LEH) with a diameter of 800 µm by square pulses from one end, delivering an energy of ∼6 kJ in 1 ns. The laser wavelength was 0.35 μm. The generated x-rays, with a peak radiation temperature Tr ≈ 240 eV, were delivered into the cylindrical CH foam, driving a supersonic heat wave within it. A glint shield composed of 0.1 µm thick Au foil and 1 µm thick CH foil was placed between the halfraum and the foam sample with the purpose of eliminating any reflected laser that might preheat the foam. The CH foam cylinders at 19.9 mg/cm3 (uncertainty ∼3.1%), with lengths 1000 and 1500 µm and diameter 1000 µm, were surrounded with a 20 µm thick Au sleeve.22 The radiation fluxes out of the CH foam cylinders at different angles (45°, 56°, and 67°) relative to the foam cylinder axis were measured using flat-response x-ray detectors (FXRDs).23,24 The Tr at 20° relative to the halfraum axis was measured from the LEH using a soft x-ray spectrometer (SXS).
![]()
Figure 1.Schematic of the targets for the experiments.
In this paper, we analyze the radiation fluxes out of the foam using the two-dimensional (2D) radiation hydrodynamic code LARED-R.25,26 Since it is difficult to validate opacity and EOS data for high-Z plasmas, and uncertainties exist in the measured Tr and the original foam density ρ0, multipliers are introduced to adjust the Au material parameters, Tr, and ρ0 in our simulations to better explain the measurements. The dependences of the peak radiation flux Fmax and the breakout time of the heat wave thalf (defined as the time corresponding to the radiation flux at half-maximum) on the radiation source, opacity, EOS, and ρ0 scaling factors (ηsrc, ηop, ηeos, and ηρ) are investigated via numerical simulations combined with fitting. Then, with the uncertainties in the measured Tr and ρ0 fixed at 3.6% and 3.1%, respectively, the ranges of ηop and ηeos are determined using experimental data as fiducial values and are compared with those presented in our previous work.12 Finally based on the scaled opacity and EOS parameters, Fmax and thalf obtained via simulations are found to be fairly consistent with the measurements, with maximum errors ∼9.5% and within 100 ps, respectively.
The remainder of this paper is organized as follows. In Sec. II, we briefly describe the simulation code LARED-R and the computational model employed in this study. In Sec. III, an analyses and discussion of the experimental results are presented. Finally, in Sec. IV, concluding remarks are made.
II. MODEL AND METHOD
The propagation of the heat wave within the foam sample is simulated using the LARED-R code, which is a 2D Lagrangian radiation hydrodynamic code in cylindrical geometry. It code includes three kinds of radiative models: multigroup radiative diffusion, multigroup radiative transfer, and multigroup radiative transfer and diffusion coupling. The electrons and ions are assumed to be in respective local thermodynamic equilibrium (LTE) states, with individual temperatures Te and Ti.
In our simulations, the heated glint shield and CH foam cylinders, which are optically thin, are simulated based on the multigroup radiative transfer model. The Au sleeve is always optically thick and is simulated using the multigroup radiative diffusion model. The opacity data for Au and CH plasmas are obtained using the OPINCH code,27 based on a relativistic Hartree–Fock–Slater (HFS) self-consistent average atom model.
The EOS data for CH and Au plasmas are extracted from the quotidian equation of state (QEOS)28 and our unpublished internal scientific report, respectively. The independent thermodynamic variables in the Au EOS are the density and the temperature. The ions are treated as an ideal gas with pressure pi and specific internal energy ϵi given by
III. RESULTS AND DISCUSSION
First, in Sec. III A, we describe the radiation source in our simulations, present the simulation results calculated with LARED-R using the original Au material parameters, and discuss the possible physical factors resulting in discrepancies between simulations and experiments. Second, in Sec. III B, we investigate the dependences of Fmax and thalf on the radiation source, opacity, EOS, and ρ0 scaling factors (ηsrc, ηop, ηeos, and ηρ) by combining simulations with fitting. Then, with the uncertainties in the measured Tr and ρ0 fixed at 3.6% and 3.1%, respectively, we determine the ranges of ηop and ηeos by using experimental data as fiducial values. Finally, simulation results based on the scaled Au material parameters are presented and compared with the experiments.
A. Simulation results using the original Au material parameters
In the experiments, the laser-heated Au halfraums provided a time-dependent radiation source, which drove supersonic heat waves within the CH foam cylinders. In our simulations, the glint shield, the CH foam cylinder, and the Au sleeve are treated as a system, and the radiation source is applied at the boundary of the glint shield as a surface source. The source is fixed in space during the heat wave propagation. Time profiles of Tr at 20° measured by the SXS from the LEH are shown in Fig. 2. The black solid lines show time profiles of Tr measured in different shots. The average Tr of these shots, shown by the red solid line, is used as the radiation source in the following simulations. The standard deviation of the peak Tr measured in different shots is 0.7%. The systematic error in the flux measurement is about 15% of the peak flux, corresponding to a systematic error of 3.5% in Tr. Thus, the total uncertainty in Tr is calculated from the two kinds of errors as
![]()
Figure 2.Time profiles of
Figure 3 shows a comparison of the radiation fluxes out of the 1000 µm [(a)–(c)] and 1500 µm [(d)–(f)] foam cylinders at 45°, 56°, and 67° between the measurements from different shots (shown in black) and simulated results derived from the original radiation source and Au material parameters (shown in red). The gray regions show the measurement errors for the time and fluxes, which are about 100 ps and 15% of the peak flux, respectively.23 It is found that the simulated results do not match the measurements very well. The simulated Fmax is generally smaller than the experimental data. The simulated thalf at 45° and 67° for the 1000 µm foam is consistent with experimental data, but the other simulated thalf is larger than the measurements by about 120–160 ps.
![]()
Figure 3.Comparison of the radiation fluxes out of the 1000
Discrepancies between simulated and experimental results may result from the not completely accurate CH material parameters, the original CH foam density ρ0, the Au material parameters, and the radiation source. In this work, the CH foam is treated as a uniform plasma, because our theoretical estimation shows that the pores in the CH foam close within 50 ps after it was heated by the radiation, and this pore closure time is much shorter than the radiation source duration of about 2 ns.
The sensitivity of the flux out of the CH foam to the CH properties is also assessed in this work. On comparing the current CH opacity and EOS with the results from other models at typical CH densities, it is found that the maximum difference between the current material parameters and the results from other models is about 10% when the temperature is below 240 eV. Simulations show that a 10% difference in the CH material parameters can lead to a 1% difference in Fmax and a 10 ps difference in thalf, which are much smaller than the measurement errors. Therefore, the CH material parameters used in our simulations can be considered to be relatively accurate. Furthermore, the Au material parameters have a more significant effect on the propagation of the heat wave within the foam sample. As shown in Fig. 4, the proportion of the radiation fluxes emitted by the Au plasma in the total flux is evidently larger than that of the radiation flux emitted by the CH plasma at 45°, 56°, and 67°, which indicates that the emission behavior of the Au plasma has a strong influence on the measured radiation flux. Thus, the effect of the uncertainty in CH material parameters on the radiation transport process is neglected in the following simulations. Multipliers are introduced to scale ρ0, the Au material parameters, and the radiation source to better explain the measurements.
![]()
Figure 4.Time profiles of the radiation fluxes emitted by the Au plasma (green solid line), CH plasma (red solid line), and the entire foam cylinder (blue solid line) at (a) 45°, (b) 56°, and (c) 67° for a 1000
B. Obtaining the scaling factors and simulation results using the scaled Au material parameters
The radiation drive temperature is scaled as
Owing to limited computational resources, a series of simulations are performed corresponding to certain values of ηsrc, ηop, ηeos, and ηρ, and then Fmax and thalf are fitted to the following function of these scaling factors:
| Length (μm) | Angle (deg) | Fmax | thalf | ||||||||
|---|---|---|---|---|---|---|---|---|---|---|---|
| α | β | γ | δ | χ2 | α | β | γ | δ | χ2 | ||
| 45 | 5.981 | −0.130 | −0.480 | −0.262 | 4.0 × 10⁻³ | −1.860 | 0.053 | 0.087 | 0.472 | 4.1 × 10⁻⁵ | |
| 1000 | 56 | 6.028 | −0.089 | −0.508 | −0.278 | 3.9 × 10⁻³ | −1.804 | 0.050 | 0.089 | 0.464 | 5.3 × 10⁻⁵ |
| 67 | 6.038 | −0.050 | −0.518 | −0.306 | 4.7 × 10⁻³ | −1.777 | 0.047 | 0.091 | 0.457 | 5.9 × 10⁻⁵ | |
| 45 | 10.908 | −0.206 | −0.910 | −1.624 | 3.1 × 10⁻³ | −2.110 | 0.054 | 0.113 | 0.643 | 1.6 × 10⁻⁴ | |
| 1500 | 56 | 10.299 | −0.113 | −0.882 | −1.071 | 8.7 × 10⁻³ | −2.389 | 0.071 | 0.140 | 0.815 | 7.2 × 10⁻⁴ |
| 67 | 9.950 | −0.047 | −0.866 | −0.893 | 1.3 × 10⁻² | −2.553 | 0.080 | 0.157 | 0.880 | 8.5 × 10⁻⁴ | |
Table 1. Fitting coefficients for the peak radiation flux Fmax and the breakout time of the heat wave thalf of the 1000 and 1500 µm foam cylinders at 45°, 56°, and 67°.
![]()
Figure 5.Plots of (a)
As shown in Table I, the values of α, β, γ, and δ for the 1500 μm foam are larger than those for the 1000 μm foam, indicating that the radiation fluxes of the 1500 μm foam are more sensitive to the radiation source, material properties, and foam density than those of the 1000 μm foam. Therefore, the fluctuations of experimental data for the 1500 μm foam are obviously larger than those for the 1000 μm foam, as shown in Fig. 3.
With the fitting coefficients α, β, γ, and δ in Eq. (13) fixed, an experimental value of Fmax or thalf can determine a relationship between ηsrc, ηop, ηeos, and ηρ. For given radiation source, foam density, and experimental values, the relationship between ηsrc, ηop, ηeos, and ηρ is reduced to a relationship between ηop and ηeos, which corresponds to a curve in ηop–ηeos space. Since uncertainties of 3.6%, 3.1%, 100 ps, and 15% exist in the measured Tr, ρ0, thalf, and Fmax, respectively, the relationship between ηop and ηeos corresponds to a band in ηop–ηeos space. Next, we give a detailed description of our method for determining this band. With θ representing one of the angles 45°, 56°, and 67°, and Gθ representing the characteristic quantity Fmax or thalf at θ, we can use available experimental data to define the range of Gθ as
The ranges of the Au opacity and EOS scaling factors ηop and ηeos fixed by this experiment are displayed in Fig. 6. The red band denotes the range of (ηop, ηeos) determined by Fmax, and the green band denotes the range of (ηop, ηeos) determined by thalf. We also plot the ranges of ηop and ηeos fixed in our previous work,12 where the yellow band shows the range fixed by a foam-confined plasma expansion experiment.12,19 The blue band shows the range fixed by an Au foil burnthrough experiment.21 It should be noted that the four bands partially overlap, which suggests that the key physical factors in this experiment have been included, as well as providing a further demonstration of the theoretical approach proposed in our previous work.12
![]()
Figure 6.Ranges of Au opacity and EOS scaling factors
The center of the region of overlap is located at approximately (ηop = 0.95, ηeos = 0.65). Employing the scaled Au opacity and EOS parameters corresponding to (ηop = 0.95, ηeos = 0.65), we perform numerical simulations again. Figure 7 shows comparisons of the angular dependence of the peak fluxes out of the 1000 and 1500 µm foams between experiment (black solid squares) and simulations. The red dashed and solid lines show the simulated results calculated using the original and scaled Au material parameters, respectively. It can be seen that the results calculated using the scaled Au material parameters agree better with the experimental data. In Fig. 8, we present a comparison of the radiation fluxes out of the 1000 µm [(a)–(c)] and 1500 µm [(d)–(f)] foam cylinders at 45°, 56°, and 67° between the simulated results with scaled (shown in green) and original (shown in red) Au material parameters and the experimental measurements (shown in black). From this figure, we can also see that the simulated fluxes drop faster than the experimental data, which suggests that the simulated cooling process of the foam and Au sleeve is faster than the experimental process. This phenomenon will be studied in our future work.
![]()
Figure 7.Comparisons of the angular dependence of the peak fluxes out of the 1000
![]()
Figure 8.Comparisons of the radiation fluxes out of the 1000
IV. CONCLUSIONS
In summary, the radiation fluxes out of CH foam cylinders at different angles have been analyzed theoretically to explain measurements in radiation transport experiments. Owing to the difficulty in validating the Au material parameters and to uncertainties in Tr and ρ0, multipliers have been introduced to scale the Au material parameters, Tr, and ρ0 in our simulations. The dependences of Fmax and thalf on ηsrc, ηop, ηeos, and ηρ have been explored via a combination of numerical simulations and fitting. Then, with the uncertainties in the measured Tr and ρ0 fixed at 3.6% and 3.1%, respectively, the ranges of ηop and ηeos have been determined by using experimental data as fiducial values. It is found that the ranges of ηop and ηeos fixed by this experiment overlap partially with those in Ref. 12, which suggests that the key physical factors in this experiment have been included, as well as providing a further demonstration of our theoretical approach proposed previously in Ref. 12. Based on the scaled opacity and EOS parameters, Fmax and thalf obtained via numerical simulations are in good agreement with the measurements, and their maximum errors are smaller than the measurement uncertainties. These opacity and EOS scaling factors can be used in radiation hydrodynamic simulations within the appropriate drive temperature regions.
ACKNOWLEDGMENTS
Acknowledgment. This work was supported by the National Key R&D Program of China under Grant No. 2017YFA0403200.
References
[1] F.Albert, P. A.Amendt, L. F.Berzak Hopkins, D. K.Bradley, D. A.Callahan, D. T.Casey, D. S.Clark, E. L.Dewald, T. R.Dittrich, L.Divol, T.D?ppner, M. J.Edwards, J. E.Field, S. W.Haan, G. N.Hall, B. A.Hammel, D. E.Hinkel, D. D.Ho, M.Hohenberger, W. W.Hsing, O. A.Hurricane, N.Izumi, O. S.Jones, S. F.Khan, J. L.Kline, A. L.Kritcher, O. L.Landen, S.LePape, T.Ma, A. J.MacKinnon, A. G.MacPhee, L.Masse, N. B.Meezan, J. L.Milovich, A.Nikroo, A.Pak, H.-S.Park, P. K.Patel, J. L.Peterson, H. F.Robey, J. S.Ross, J. D.Salmonson, V. A.Smalyuk, B. K.Spears, M.Stadermann, L. J.Suter, C. A.Thomas, R.Tommasini, R. P. J.Town, D. P.Turnbull, C. R.Weber. Indirect drive ignition at the National Ignition Facility. Plasma Phys. Controlled Fusion, 59, 014021(2017).
[2] R. E.Marshak. Effect of radiation on shock wave behavior. Phys. Fluids, 1, 24(1958).
[3] P.Amendt, R. L.Berger, S. G.Glendinning, S. H.Glenzer, S. W.Haan, R. L.Kauffman, O. L.Landen, J. D.Lindl, L. J.Suter. The physics basis for ignition using indirect-drive targets on the National Ignition Facility. Phys. Plasmas, 11, 339(2004).
[4] C. A.Back, A. B. R.Cooper, K.Dodson, M. E.Foord, J. M.Foster, P.Graham, W. W.Hsing, J. F.Hund, K.Lu, S. A.MacLaren, B. R.Maddox, R. E.Marrs, M. J.May, A. S.Moore, J. D.Sain, M. B.Schneider, R.Seugling, V.Smalyuk, P. E.Young. Streaked radiography of an irradiated foam sample on the National Ignition Facility. Phys. Plasmas, 20, 033301(2013).
[5] C. A.Back, K.Baker, J.Castor, A. J.Comley, A. B. R.Cooper, J.Foster, G.Glendinning, P.Graham, W. W.Hsing, J.Hund, J.Klingmann, K.Lu, S.MacLaren, R.Marrs, M.May, A. S.Moore, J.Sain, J.Satcher, M. B.Schneider, R.Seugling, K.Widmann, B.Young, P.Young. Radiation transport and energetics of laser-driven half-hohlraums at the National Ignition Facility. Phys. Plasmas, 21, 063303(2014).
[6] B. W.Mihalas, D.Mihalas. Foundations of Radiation Hydrodynamics(1966).
[7] G. C.Pomraning. The Equations of Radiation Hydrodynamics(1973).
[8] Y. P.Raizer, Y. B.Zeldovich. Physics of Shock Waves and High Temperature Hydrodynamics Phenomena(1984).
[9] J.Li, J.Li, G.Meng. Reversal of Hugoniot Iocus for strong shocks due to radiation. Phys. Plasmas, 18, 042301(2011).
[10] J. O.Kane, A.Mizuta, M. W.Pound, B. A.Remington, D. D.Ryutov, H.Takabe. Formation of pillars at the boundaries between H II regions and molecular clouds. Astrophys. J., 647, 1151(2006).
[11] J. H.Hammer, M. D.Rosen. A consistent approach to solving the radiation diffusion equation. Phys. Plasmas, 10, 1829(2003).
[12] J.Li, G.Meng, M.Wang, J.Yang, W.Zhang, T.Zhu, S.Zou. A simple method to verify the opacity and equation of state of high-Z plasmas. Phys. Plasmas, 20, 092704(2013).
[13] J. H.Hammer, O. A.Hurricane. Bent Marshak waves. Phys. Plasmas, 13, 113303(2006).
[14] J.Li, G.Meng, J.Wang, X.Wang, W.Zhang. Generation of a sharp density increase in radiation transport between high-Z and low-Z plasmas. Matter Radiat. Extremes, 1, 249(2016).
[15] S. I.Heizler, T.Shussman. Full self-similar solutions of the subsonic radiative heat equations. Phys. Plasmas, 22, 082109(2015).
[16] C. A.Back, J. D.Bauer, J. H.Hammer, W. W.Hsing, O. L.Landen, B. F.Lasinski, P. W.Rambo, M. D.Rosen, L. J.Suter, R. E.Turner. Diffusive, supersonic x-ray transport in radiatively heated foam cylinders. Phys. Plasmas, 7, 2126(2000).
[17] S.Allan, N.Bazin, J.Benstead, C.Bentley, A. J.Comley, J.Cowan, K.Flippo, W.Garbett, T. M.Guymer, C.Hamilton, J. L.Kline, N. E.Lanier, A. S.Moore, J.Morton, K.Mussack, K.Obrey, L.Reed, D. W.Schmidt, R. M.Stevenson, J. M.Taccetti, J.Workman. Quantifying equation-of-state and opacity errors using integrated supersonic diffusive radiation flow experiments on the National Ignition Facility. Phys. Plasmas, 22, 043303(2015).
[18] W.Shang, T.Song, G.Xiong, J.Yang, J.Zhang, W.Zhang, Y.Zhao, T.Zhu. Study of x-ray radiant characteristics and thermal radiation redistribution in CH foam filling cylindrical cavities. Phys. Plasmas, 18, 042705(2011).
[19] Y.Ding, Y.Ding, X.He, Z.Hu, J.Li, S.Liu, G.Meng, Y.Xu, J.Yang, R.Yi, J.Zhang, T.Zhu. Experimental study of the hydrodynamic trajectory of an x-ray-heated gold plasmas. Phys. Plasmas, 17, 062702(2010).
[20] L.Barringer, D.Hoarty, C.Vickers, O.Willi. Study of super- and subsonic ionization fronts in low-density, soft X-ray-irradiated foam targets. Astrophys. J., Suppl. Ser., 127, 527(2000).
[21] C.Wu(2008).
[22] C.Huang, X.Luo(2015).
[23] Y.Ding, H.Du, L.Guo, T.Huang, S.Jiang, X.Jiang, S.Li, Z.Li, S.Liu, Y.Liu, T.Song, J.Yang, R.Yi, X.Zhao, J.Zheng. A novel flat-response x-ray detector in the photon energy range of 0.1–4 keV. Rev. Sci. Instrum., 81, 073504(2010).
[24] Y.Ding, L.Guo, S.Jiang, X.Jiang, S.Li, Z.Li, T.Song, Z.Wang, D.Yang, R.Yi, H.Zhang. The influence of laser clipped by the laser entrance hole on hohlraum radiation measurement on Shenguang-III prototype. Rev. Sci. Instrum., 85, 033504(2014).
[25] T.Feng. A numerical method for solving radiation transport equation on Lagrangian mesh. Chin. J. Comput. Phys., 21, 427(2004).
[26] L.Jinghong, Y.Rong, H.Xudeng. A two-dimensional cylindric symmetric radiative transfer benchmark model and code tests. Chin. J. Comput. Phys., 27, 533(2010).
[27] S. J.Davidson, C. A.Iglesias, E.Minguez, F. J. D.Serduke. WorkOp-IV summary: Lessons from iron opacities. J. Quant. Spectrosc. Radiat. Transfer, 65, 527(2000).
[28] R. M.More, K. H.Warren, D. A.Young, G. B.Zimmerman. A new quotidian equation of state (QEOS) for hot dens matter. Phys. Fluids, 31, 3059(1988).
[29] The Compilation Group of Handbook of Mathematics. Handbook of Mathematics, 865-866(1979).


Set citation alerts for the article
Please enter your email address

© Copyright 2018-2021 | Chinese Laser Press. All Rights Reserved 沪ICP备15018463号-20