• Advanced Photonics
  • Vol. 4, Issue 4, 045001 (2022)
Zhihao Zhou1, Wei Liu2, Hengzhe Yan1, Xianfeng Chen2, and Wenjie Wan1、2、*
Author Affiliations
  • 1Shanghai Jiao Tong University, University of Michigan–Shanghai Jiao Tong University Joint Institute, State Key Laboratory of Advanced Optical Communication Systems and Networks, Shanghai, China
  • 2Shanghai Jiao Tong University, Department of Physics and Astronomy, Shanghai, China
  • show less
    DOI: 10.1117/1.AP.4.4.045001 Cite this Article Set citation alerts
    Zhihao Zhou, Wei Liu, Hengzhe Yan, Xianfeng Chen, Wenjie Wan. Nonlinear thermal emission and visible thermometry[J]. Advanced Photonics, 2022, 4(4): 045001 Copy Citation Text show less
    Nonlinear thermal emission through nonlinear upconversion. A 1064-nm pump laser is used to convert mid-IR thermal radiation into visible wavelengths through the sum-frequency generation in a medium containing a quadratic nonlinearity. With the presence of optical pumping, a thermal object can simultaneously emit thermal radiation at both visible-NIR and mid-IR spectral bands.
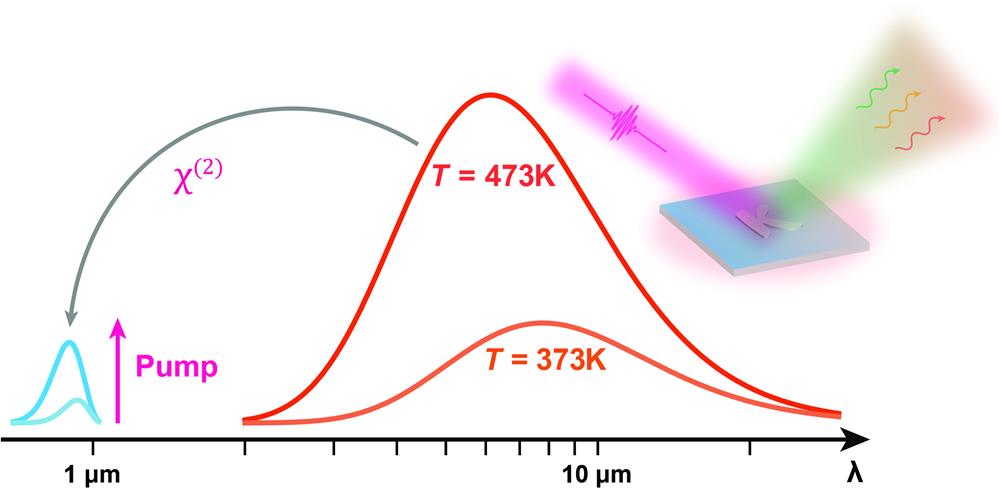
    Fig. 1. Nonlinear thermal emission through nonlinear upconversion. A 1064-nm pump laser is used to convert mid-IR thermal radiation into visible wavelengths through the sum-frequency generation in a medium containing a quadratic nonlinearity. With the presence of optical pumping, a thermal object can simultaneously emit thermal radiation at both visible-NIR and mid-IR spectral bands.
    Nonlinear thermal emission enabled by random quasi-phase-matching. (a) Experimental schematics: signals emitted from the thermal target are filtered with notch filters to reject fundamental, second-harmonic of the pump beam, and then split into two paths, which are further collected by an imaging system and spectrometer, respectively. (b) SEM image of LiNbO3 nanocrystals ground from bulk LiNbO3, which ensures the random quasi-phase-matching condition (scalebar: 1 μm). The inset shows the image of LiNbO3 powder in real color. (c) The spectral signal is collected from a bulk LiNbO3 crystal and random nanocrystals, where both targets are heated to 533 K and pumped with a 500-mW femtosecond beam at 1064 nm. While the disordered sample depicts a growing spectral signal, no visible signal is observed from the bulk one’s spectrum.
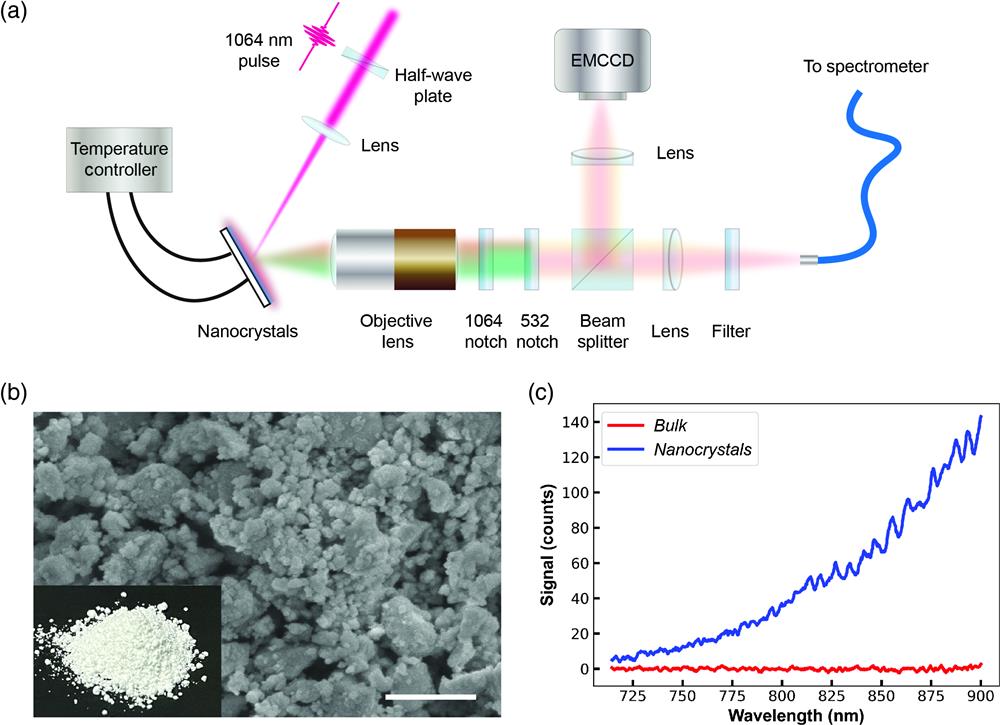
    Fig. 2. Nonlinear thermal emission enabled by random quasi-phase-matching. (a) Experimental schematics: signals emitted from the thermal target are filtered with notch filters to reject fundamental, second-harmonic of the pump beam, and then split into two paths, which are further collected by an imaging system and spectrometer, respectively. (b) SEM image of LiNbO3 nanocrystals ground from bulk LiNbO3, which ensures the random quasi-phase-matching condition (scalebar: 1  μm). The inset shows the image of LiNbO3 powder in real color. (c) The spectral signal is collected from a bulk LiNbO3 crystal and random nanocrystals, where both targets are heated to 533 K and pumped with a 500-mW femtosecond beam at 1064 nm. While the disordered sample depicts a growing spectral signal, no visible signal is observed from the bulk one’s spectrum.
    The spectra of nonlinear thermal emission. (a) The absorption coefficient of LiNbO3 at wavelength from 2.9 to 5.2 μm measured by FTIR spectroscopy. (b) Ideal blackbody radiation under different temperatures predicted by Planck’s law. (c) Theoretically calculated nonlinear thermal emission of LiNbO3 according to Kirchhoff’s law. As the temperature grows from 303 to 523 K, the intensity of nonlinear thermal radiation keeps growing because of a substantial increase of blackbody radiation in the corresponding mid-IR range. (d) Experimentally measured spectra of nonlinear thermal emission with various temperatures.
    Fig. 3. The spectra of nonlinear thermal emission. (a) The absorption coefficient of LiNbO3 at wavelength from 2.9 to 5.2  μm measured by FTIR spectroscopy. (b) Ideal blackbody radiation under different temperatures predicted by Planck’s law. (c) Theoretically calculated nonlinear thermal emission of LiNbO3 according to Kirchhoff’s law. As the temperature grows from 303 to 523 K, the intensity of nonlinear thermal radiation keeps growing because of a substantial increase of blackbody radiation in the corresponding mid-IR range. (d) Experimentally measured spectra of nonlinear thermal emission with various temperatures.
    Pump-power dependence and polarization properties of nonlinear thermal emission. (a) Experimental results of nonlinear thermal emission show a clear growing trend of irradiance when the pump power increases. Inset shows that the overall irradiance is linearly dependent on the pump power by summing over the entire spectral range. (b) Measured far-field polarization patterns of the emission under two orthogonal pump polarizations, indicating insensitivity of the signal on pump polarizations. (c) Far-field polarization patterns collected from three randomly picked locations. The overall polarization state of nonlinear thermal emission remains unchanged, but the intensity varies because of local anisotropy.
    Fig. 4. Pump-power dependence and polarization properties of nonlinear thermal emission. (a) Experimental results of nonlinear thermal emission show a clear growing trend of irradiance when the pump power increases. Inset shows that the overall irradiance is linearly dependent on the pump power by summing over the entire spectral range. (b) Measured far-field polarization patterns of the emission under two orthogonal pump polarizations, indicating insensitivity of the signal on pump polarizations. (c) Far-field polarization patterns collected from three randomly picked locations. The overall polarization state of nonlinear thermal emission remains unchanged, but the intensity varies because of local anisotropy.
    Demonstration of visible thermometry. (a) Visible images of a letter “K” made of LiNbO3 nanocrystals under different temperatures (scalebar: 100 μm). Overall, the captured visible thermal image becomes brighter as the target’s temperature increases. Nonuniform signals inside the target suggest local hot spots. A dashed circle indicates the region used to calibrate the irradiance-temperature relationship. (b) Calibration curve of the relationship between signal and target temperature derived from Eq. (3). In this manner, we can accurately determine the temperature of the interested region via its emission intensity. Here, the thermometry resolution is only dependent on the optical resolution of the microscopic system.
    Fig. 5. Demonstration of visible thermometry. (a) Visible images of a letter “K” made of LiNbO3 nanocrystals under different temperatures (scalebar: 100  μm). Overall, the captured visible thermal image becomes brighter as the target’s temperature increases. Nonuniform signals inside the target suggest local hot spots. A dashed circle indicates the region used to calibrate the irradiance-temperature relationship. (b) Calibration curve of the relationship between signal and target temperature derived from Eq. (3). In this manner, we can accurately determine the temperature of the interested region via its emission intensity. Here, the thermometry resolution is only dependent on the optical resolution of the microscopic system.
    Zhihao Zhou, Wei Liu, Hengzhe Yan, Xianfeng Chen, Wenjie Wan. Nonlinear thermal emission and visible thermometry[J]. Advanced Photonics, 2022, 4(4): 045001
    Download Citation