
Zhao Liu, Lihua Pan, Xiaoqiang Li, Jian Gao, Ke Zhang. Study on Microstructure and Properties of Laser-Welded 30Cr3 Ultra-High-Strength Steel Joints Based on Weld Penetration Mode[J]. Chinese Journal of Lasers, 2023, 50(12): 1202104
- Chinese Journal of Lasers
- Vol. 50, Issue 12, 1202104 (2023)
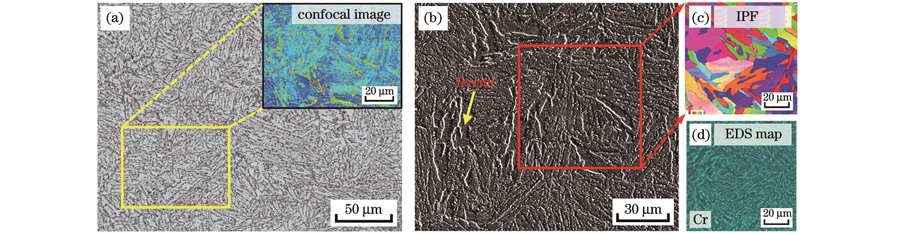
Fig. 1. Microstructures of 30Cr3 base metal. (a) Optical and confocal images; (b) SEM image; (c) IPF; (d) EDS plane distribution of Cr element
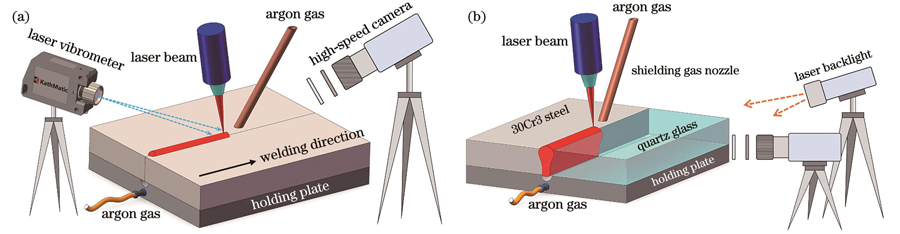
Fig. 2. Schematics of test devices. (a) Observing dynamic behavior of molten pool; (b) observing dynamic behavior of keyhole
Fig. 3. Dynamic behaviors of keyholes under different weld penetration modes. (a1)-(a5) Keyhole unpenetrated fusion mode; (b1)-(b5) keyhole critical penetration fusion mode; (c1)-(c5) keyhole stably penetrated fusion mode
Fig. 4. High speed photographic images of molten pool during welding process under different laser powers. (a) 3.4 kW; (b) 3.5 kW; (c) 3.6 kW; (d) 3.7 kW
Fig. 5. Average amplitudes and standard variances of molten pool surface vibrations under different laser powers
Fig. 6. Cross section morphologies and sizes of welded joints under different laser powers. (a)(d) 3.4 kW, morphology; (b)(e) 3.5 kW, morphology; (c)(f) 3.6 kW, morphology; (g) size
Fig. 7. Morphologies of rear welds under different laser powers. (a)(e) 3.4 kW; (b)(f) 3.5 kW; (c)(g) 3.6 kW; (d)(h) 3.7 kW
Fig. 8. Microstructure of weld. (a) SEM image of weld microstructure; (b) partial magnification view of Fig. 8(a)
Fig. 9. EBSD analysis results of weld microstructures under different laser powers. (a)(e)(i) 3.4 kW; (b)(f)(j) 3.5 kW; (c)(g)(k) 3.6 kW; (d)(h)(l) 3.7 kW
Fig. 10. XRD analysis results of weld microstructures under different laser powers. (a) XRD patterns; (b) partial magnification view of Fig. 10(a); (c) SEM image of metallic oxide
Fig. 11. Tensile properties of welded joints under different laser powers. (a) Without heat treatment; (b) with post-weld heat treatment
Fig. 12. Fracture locations and fracture morphologies of tensile samples. (a)(b) Without heat treatment; (c)(d) after post-weld heat treatment
Fig. 13. Longitudinal microhardness distributions of welded joints under different laser powers. (a) 3.4 kW; (b) 3.5 kW; (c) 3.6 kW; (d) 3.7 kW
|
Table 1. Chemical compositions of 30Cr3 ultra-high strength steel
|
Table 2. Impact test results under different laser powers

Set citation alerts for the article
Please enter your email address
© Copyright 2018-2021 | Chinese Laser Press. All Rights Reserved 沪ICP备15018463号-20