
Yao Chen, Yunwei Zhang, Jinhui Lei, li Li. Automatic Extraction Method for Gait Parameters of Quadruped Walking Based on Computer Vision[J]. Laser & Optoelectronics Progress, 2022, 59(8): 0815006
- Laser & Optoelectronics Progress
- Vol. 59, Issue 8, 0815006 (2022)
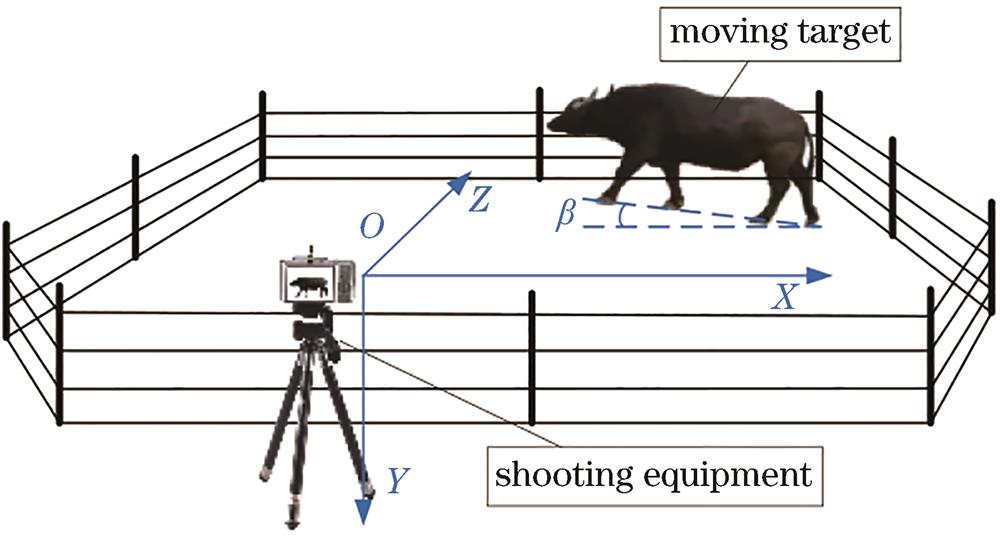
Fig. 1. Video acquisition system
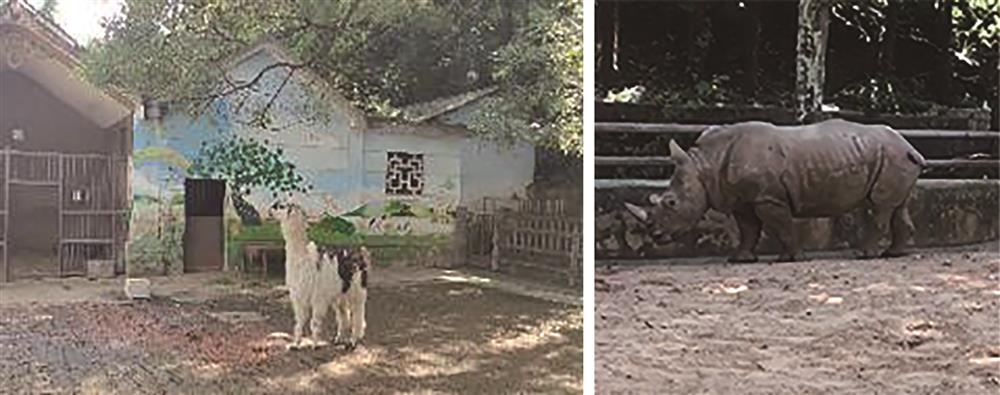
Fig. 2. Images of quadruped walking
Fig. 3. Flow chart of automatic identification of motion feature
Fig. 4. Structure of DeeplabV3+
Fig. 5. Multiscale feature fusion module
Fig. 6. DUpsampling
Fig. 7. Improved DeeplabV3+
Fig. 8. Comparison of effects of semantic segmentation.(a) Original image; (b) PSPNet; (c) Segnet; (d) Unet; (e) DeeplabV3+; (f) improved DeeplabV3+Xception
Fig. 9. Flow chart of motion corner detection and matching
Fig. 10. Schematic diagram of corner swing angle
Fig. 11. Local maximum values
Fig. 12. Corner detection of quadrupeds. (a) Corners of rhino without overlap; (b) forelimb corners of rhino with overlap; (c) hindlimb corners of buffalo with overlap; (d) forelimb corners of alpaca with overlap
Fig. 13. Curves of corner distance variation
Fig. 14. Gait cycle of each limb
Fig. 15. Motion corner detection and matching
Fig. 16. Rhino’s corner distance variation curves
Fig. 17. Rhino’s gait cycle of each limb
Fig. 18. Buffalo’s corner distance variation curves
Fig. 19. Buffalo’s gait cycle of each limb
Fig. 20. Alpaca’s corner distance variation curves
Fig. 21. Alpaca’s gait cycle of each limb
Fig. 22. Gait sequences. (a) Gait sequence of buffalo; (b) gait sequence of rhino; (c) gait sequence of alpaca
Fig. 23. Corner swing angles. (a) Corner swing angle of rhino; (b) corner swing angle of buffalo; (c) corner swing angle of alpaca
Fig. 24. Corner detection for different scales. (a) R=1.06%; (b) R=3.25%; (c) R=6.24%
| |||||||||||||||||||||||||||||
Table 1. Comparison of corner detection accuracy
| ||||||||||||||||||||||||||||||||||||||||||||||||||||||||||||||||||||||||||||||||||||||||||||||||||||||||||||||||||||||||||
Table 2. Values of cycle and frequency
| |||||||||||||||||||||||||||||||||||||||||||||||||||||||||||||||||||||||
Table 3. Comparison of stride lengths of rhino, buffalo, and alpaca

Set citation alerts for the article
Please enter your email address
© Copyright 2018-2021 | Chinese Laser Press. All Rights Reserved 沪ICP备15018463号-20