• Journal of Inorganic Materials
  • Vol. 37, Issue 10, 1093 (2022)
Chengjin LI1、2, Yi XUE1、2, Xiaoxia ZHOU2、*, and Hangrong CHEN2
Author Affiliations
  • 11. School of Materials and Chemistry, University of Shanghai for Science and Technology, Shanghai 200093, China
  • 22. Shanghai Institute of Ceramics, Chinese Academy of Sciences, Shanghai 200050, China
  • show less
    DOI: 10.15541/jim20220027 Cite this Article
    Chengjin LI, Yi XUE, Xiaoxia ZHOU, Hangrong CHEN. BiZnx/Si Photocathode: Preparation and CO2 Reduction Performance [J]. Journal of Inorganic Materials, 2022, 37(10): 1093 Copy Citation Text show less
    Schematic diagram of the fabrication of BiZnx/Si photoelectrocathode and CO2 reduction process
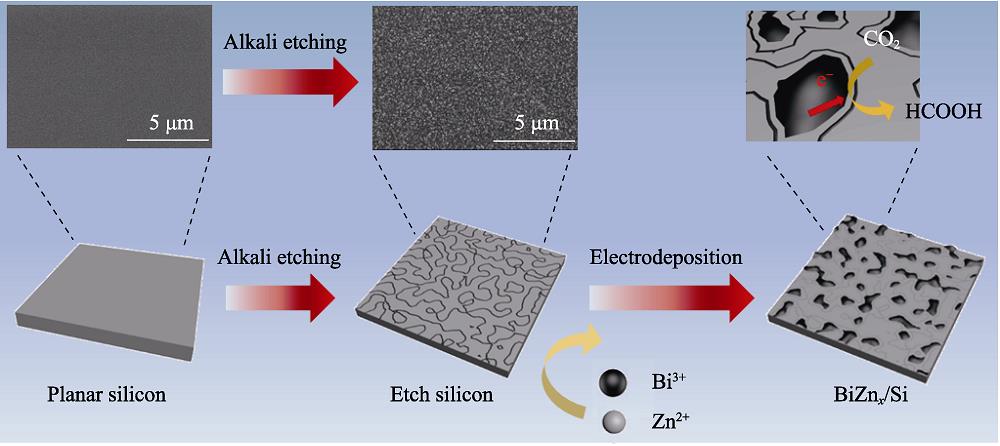
    1. Schematic diagram of the fabrication of BiZnx/Si photoelectrocathode and CO2 reduction process
    (a) Physical picture and (b) schematic model of photoelectrochemical cell for CO2 reduction
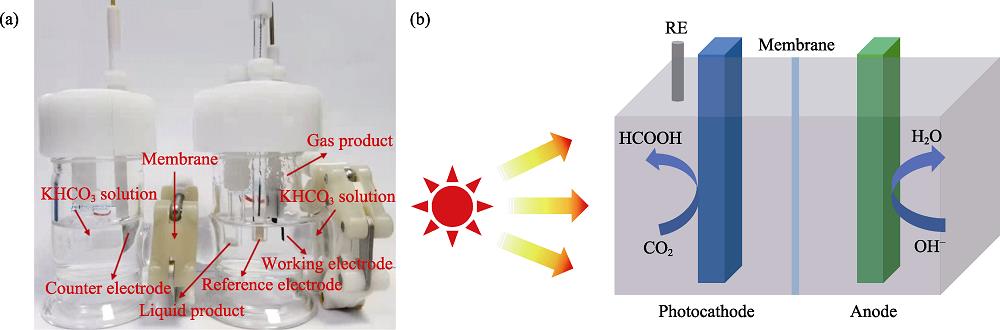
    2. (a) Physical picture and (b) schematic model of photoelectrochemical cell for CO2 reduction
    SEM images of (a) planar-Si, (b) Si treated with NaOH solution, (c) Bi/Si, (d) BiZn1/Si, (e) BiZn2/Si, and (f) BiZn3/Si with (g-i) elemental mappings of BiZn2/Si
    3. SEM images of (a) planar-Si, (b) Si treated with NaOH solution, (c) Bi/Si, (d) BiZn1/Si, (e) BiZn2/Si, and (f) BiZn3/Si with (g-i) elemental mappings of BiZn2/Si
    (a) XRD patterns of Bi/Si, BiZn1/Si, BiZn2/Si, and BiZn3/Si, and (b) UV-Vis reflectivity spectra of Planar-Si, Si-T, Bi/Si, BiZn1/Si, BiZn2/Si and BiZn3/Si
    4. (a) XRD patterns of Bi/Si, BiZn1/Si, BiZn2/Si, and BiZn3/Si, and (b) UV-Vis reflectivity spectra of Planar-Si, Si-T, Bi/Si, BiZn1/Si, BiZn2/Si and BiZn3/Si
    (a) High resolution Bi4f XPS spectra of Bi/Si, BiZn1/Si, BiZn2/Si and BiZn3/Si, (b) ratios of Bi3+/Bi0 for BiZn1/Si, BiZn2/Si, and BiZn3/Si, and (c) high resolution Zn2p XPS spectrum for BiZn2/Si
    5. (a) High resolution Bi4f XPS spectra of Bi/Si, BiZn1/Si, BiZn2/Si and BiZn3/Si, (b) ratios of Bi3+/Bi0 for BiZn1/Si, BiZn2/Si, and BiZn3/Si, and (c) high resolution Zn2p XPS spectrum for BiZn2/Si
    (a) Transient photocurrent curves of Si-T, Bi/Si, BiZn1/Si, BiZn2/Si, and BiZn3/Si, (b) LSV curves of untreated Si (Planar Si), Si-T, Bi/Si, and BiZn2/Si in Ar or CO2-saturated 0.5 mol·L-1 KHCO3 aqueous solution, (c) FE histograms of CO2 reduction productions and (d) HCOOH current densities for Bi/Si, BiZn1/Si, BiZn2/Si, and BiZn3/Si, (e) electrochemical impedance spectra (EIS) of Si-T, Bi/Si and BiZn2/Si, and (f) stability of BiZn2/Si during 10 h test
    6. (a) Transient photocurrent curves of Si-T, Bi/Si, BiZn1/Si, BiZn2/Si, and BiZn3/Si, (b) LSV curves of untreated Si (Planar Si), Si-T, Bi/Si, and BiZn2/Si in Ar or CO2-saturated 0.5 mol·L-1 KHCO3 aqueous solution, (c) FE histograms of CO2 reduction productions and (d) HCOOH current densities for Bi/Si, BiZn1/Si, BiZn2/Si, and BiZn3/Si, (e) electrochemical impedance spectra (EIS) of Si-T, Bi/Si and BiZn2/Si, and (f) stability of BiZn2/Si during 10 h test
    PEC and EC CO2 reduction performances of BiZn2/Si
    7. PEC and EC CO2 reduction performances of BiZn2/Si
    (a) ECSA lines of Bi/Si, BiZn1/Si, BiZn2/Si, and BiZn3/Si, and (b) oxidation LSV curves of PEC and EC CO2 reduction for BiZn2/Si in 0.1 mol·L-1 KOH aqueous solution
    8. (a) ECSA lines of Bi/Si, BiZn1/Si, BiZn2/Si, and BiZn3/Si, and (b) oxidation LSV curves of PEC and EC CO2 reduction for BiZn2/Si in 0.1 mol·L-1 KOH aqueous solution
    Mechanismic schematic of formation process of HCOOH on the photocathode BiZn2/Si
    9. Mechanismic schematic of formation process of HCOOH on the photocathode BiZn2/Si
    TEM and HRTEM images of (a-d) Bi/Si and (e-h) BiZn2/Si
    S1. TEM and HRTEM images of (a-d) Bi/Si and (e-h) BiZn2/Si
    Elemental distribution mapping of BiZn2/Si
    S2. Elemental distribution mapping of BiZn2/Si
    i-t curves of (a) Bi/Si, (b) BiZn1/Si, (c) BiZn2/Si and (d) BiZn3/Si
    S3. i-t curves of (a) Bi/Si, (b) BiZn1/Si, (c) BiZn2/Si and (d) BiZn3/Si
    (a-c) Images of retention time H2, CO and O2, (d) H1 NMR spectrum of liquid product
    S4. (a-c) Images of retention time H2, CO and O2, (d) H1 NMR spectrum of liquid product
    FE for PEC CO2 to CO, H2, HCOOH productions over BiZn2/Si, Bi/Si and Zn/Si
    S5. FE for PEC CO2 to CO, H2, HCOOH productions over BiZn2/Si, Bi/Si and Zn/Si
    1H NMR spectrum of the liquid phase products of BiZn2/Si in CO2-saturated 0.5 mol·L-1 KOH and Ar-saturated 0.5 mol·L-1 KHCO3 solutions for photoelechemical reduction of CO2
    S6. 1H NMR spectrum of the liquid phase products of BiZn2/Si in CO2-saturated 0.5 mol·L-1 KOH and Ar-saturated 0.5 mol·L-1 KHCO3 solutions for photoelechemical reduction of CO2
    (a) Photocurrent curves of BiZn2/Si, Bi/Si and Si-T, (b) PL spectra of BiZn2/Si, Bi/Si and Si-T
    S7. (a) Photocurrent curves of BiZn2/Si, Bi/Si and Si-T, (b) PL spectra of BiZn2/Si, Bi/Si and Si-T
    Cycling stability runs of BiZn2/Si in CO2-saturated 0.5 mol·L-1 KHCO3 solution
    S8. Cycling stability runs of BiZn2/Si in CO2-saturated 0.5 mol·L-1 KHCO3 solution
    (a) XRD patterns of BiZn2/Si before and after stability test, (b) typical SEM image of BiZn2/Si after stability test
    S9. (a) XRD patterns of BiZn2/Si before and after stability test, (b) typical SEM image of BiZn2/Si after stability test
    CV curves for (a) Bi/Si, (b) BiZn1/Si, (c) BiZn2/Si and (d) BiZn3/Si at different scan rates
    S10. CV curves for (a) Bi/Si, (b) BiZn1/Si, (c) BiZn2/Si and (d) BiZn3/Si at different scan rates
    LSV curves for BiZn1/Si, BiZn2/Si and BiZn3/Si
    S11. LSV curves for BiZn1/Si, BiZn2/Si and BiZn3/Si
    FT-IR spectra of BiZn2/Si before and after photoelectrochemical CO2 reduction reaction
    S12. FT-IR spectra of BiZn2/Si before and after photoelectrochemical CO2 reduction reaction
    Oxidation LSV curves of BiZn2/Si, Bi/Si and Si-T
    S13. Oxidation LSV curves of BiZn2/Si, Bi/Si and Si-T
    SampleBiZn1/Si BiZn2/Si BiZn3/Si
    (n)Bi/(n)Zn 14212088
    Table 1. Bi/Zn molar ratios of different samples in ICP results
    ElectrodeElectrolyteEapp/V Jtotal/(mA·cm-2) FEformateRef.
    Sn/SnOx0.5 mol·L-1 KHCO3-0.7 vs. RHE -2~38% PEC[1]
    SnO20.5 mol·L-1 NaOH -0.6 vs. RHE -3.567.6% EC[2]
    Sn foil0.5 mol·L-1 KHCO3-2.0 vs. SCE -2863.5% EC[3]
    Sn dendrite0.1 mol·L-1 KHCO3-1.36 vs. RHE -17.171.6% EC[4]
    Sn GDE0.5 mol·L-1 KHCO3-1. 8 vs. SCE -22.278.6% EC[5]
    2,2’-bpy-coordinated Cu0.5 mol·L-1 KHCO3-1.2 vs. RHE -1557.7% PEC[6]
    Si/Bi50.5 mol·L-1 KHCO3-1.03 vs. RHE -24.172.1% PEC[7]
    Bi-PMo nanosheets0.5 mol·L-1 NaHCO3-0.86 vs. RHE -3093% EC[8]
    Bi2O3 nanoparticle 0.5 mol·L-1 NaHCO3-1.2 vs. RHE -2291% EC[9]
    p-Si/Bi0.5 mol·L-1 NaHCO3-0.9 vs. RHE -1290% PEC[10]
    Bi nanoflakes0.1 mol·L-1 KHCO3-0.4 vs. RHE -79.5% EC[11]
    Cu25In750.5 mol·L-1 NaHCO3-0.7 vs. RHE -84.1% EC[12]
    In1.5Cu0.5 NPs 0.1 mol·L-1 KHCO3-1.2 vs. RHE -3.5990% EC[13]
    This work0.5 mol·L-1 KHCO3-0.8 vs. RHE -6.4596.1% PECThis work
    Table 2. Faraday efficiency and current density comparison of different photo/electrocatalysts
    Chengjin LI, Yi XUE, Xiaoxia ZHOU, Hangrong CHEN. BiZnx/Si Photocathode: Preparation and CO2 Reduction Performance [J]. Journal of Inorganic Materials, 2022, 37(10): 1093
    Download Citation