• Opto-Electronic Science
  • Vol. 1, Issue 3, 210006-1 (2022)
Vijayakumar Anand1、2、*, Molong Han1, Jovan Maksimovic1, Soon Hock Ng1, Tomas Katkus1, Annaleise Klein3, Keith Bambery3, Mark J. Tobin3, Jitraporn Vongsvivut3、*, and Saulius Juodkazis1、4、*
Author Affiliations
  • 1Optical Sciences Center and ARC Training Centre in Surface Engineering for Advanced Materials (SEAM), School of Science, Computing and Engineering Technologies, Optical Sciences Center, Swinburne University of Technology, Hawthorn, Melbourne, Victoria 3122, Australia
  • 2Institute of Physics, University of Tartu, 50411 Tartu, Estonia
  • 3Infrared Microspectroscopy (IRM) Beamline, ANSTO – Australian Synchrotron, Clayton, Victoria 3168, Australia
  • 4Tokyo Tech World Research Hub Initiative (WRHI), School of Materials and Chemical Technology, Tokyo Institute of Technology, 2-12-1, Ookayama, Meguro-ku, Tokyo 152-8550, Japan
  • show less
    DOI: 10.29026/oes.2022.210006 Cite this Article
    Vijayakumar Anand, Molong Han, Jovan Maksimovic, Soon Hock Ng, Tomas Katkus, Annaleise Klein, Keith Bambery, Mark J. Tobin, Jitraporn Vongsvivut, Saulius Juodkazis. Single-shot mid-infrared incoherent holography using Lucy-Richardson-Rosen algorithm[J]. Opto-Electronic Science, 2022, 1(3): 210006-1 Copy Citation Text show less
    Simplified schematic of the FTIR microspectroscopic system and the measured spatial and spectral characteristics. (a) Abbreviations: COL – Cassegrain objective lens, IR – Infrared, BS – beam splitter, M – mirror, L – lens, FTIR – Fourier transform infrared spectrometer, FPA – focal plane array, MSP – Motorized sliding plate, MCT - mercury-cadmium-telluride, A – aperture, MIR – mid infrared, PSF – point spread function. The MIR from the FTIR spectrometer is sent into the IR/VISIBLE microscope. The microscope is aligned collinearly for both MIR and reference visible light. There are two modes of operation: (reflection and transmission) and two modes of data recording (mapping using single element MCT detector and imaging using multi-element FPA detector). (b) Spectral profile of the GlobarTM source with 14 spectral channels marked in blue are selected for the study. (c–e) 4D plot of the PSFs recorded for an axial aberration Δz = 0, 125 μm and 250 μm, respectively. Spectral cube data PSF(x, y, ν) was formed from the 14 spectral channels each averaged over 100 spectral channels –50 to +50 channels. The non-changing pattern along ν indicates spectral aberrations suppressed by the COL. (f–h). Autocorrelation cube data of (c–e), respectively. The thin cylindrical structures obtained for Δz = 125 μm and 250 μm indicates the possibility of imaging in deconvolution mode with a similar resolving power as Δz = 0 μm. (i) Depth cube data PSF(x, y, Δz) from 0 to 250 μm. Unlike a regular lens where the intensity distribution is filled, the COL generates hollow intensity distribution with four distinct lobes causing a sharp autocorrelation function. (j) The spectral and spatial cube data were combined to form 8415 spatio-spectral images corresponding to the 14 spectral channels and aberrations 0 to 250 μm in steps of 25 μm and was cross-correlated with the image corresponding to the central spatio-spectral point (2307 cm–1, 125 μm) and cross-correlation value at the origin (x=0, y=0) is plotted. The FWHM along z was ~50 μm indicating that the intensity of a plane 50 μm apart has a loss of about 50% of intensity which is ideal for 3D MIR imaging applications.
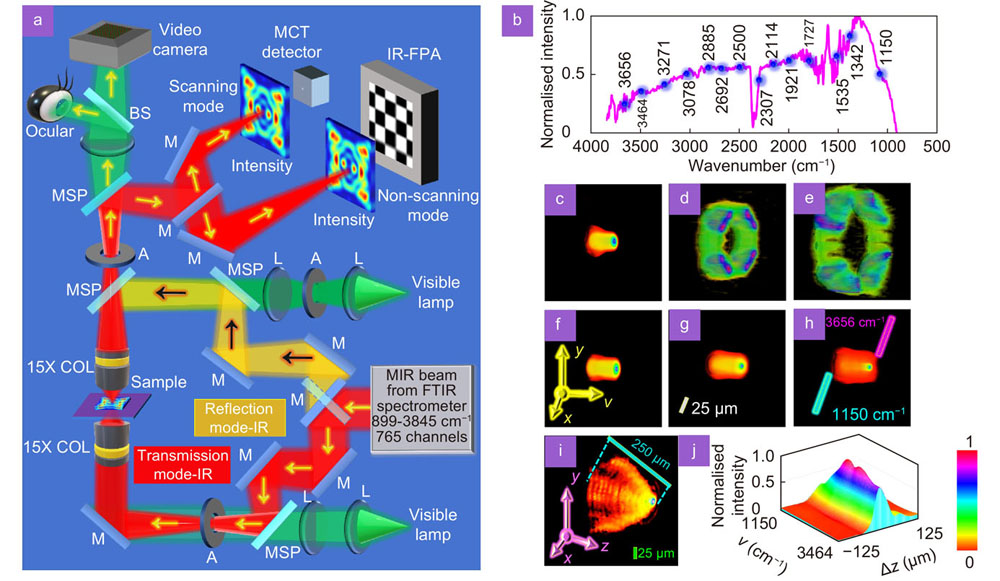
    Fig. 1. Simplified schematic of the FTIR microspectroscopic system and the measured spatial and spectral characteristics. (a) Abbreviations: COL – Cassegrain objective lens, IR – Infrared, BS – beam splitter, M – mirror, L – lens, FTIR – Fourier transform infrared spectrometer, FPA – focal plane array, MSP – Motorized sliding plate, MCT - mercury-cadmium-telluride, A – aperture, MIR – mid infrared, PSF – point spread function. The MIR from the FTIR spectrometer is sent into the IR/VISIBLE microscope. The microscope is aligned collinearly for both MIR and reference visible light. There are two modes of operation: (reflection and transmission) and two modes of data recording (mapping using single element MCT detector and imaging using multi-element FPA detector). (b) Spectral profile of the GlobarTM source with 14 spectral channels marked in blue are selected for the study. (ce) 4D plot of the PSFs recorded for an axial aberration Δz = 0, 125 μm and 250 μm, respectively. Spectral cube data PSF(x, y, ν) was formed from the 14 spectral channels each averaged over 100 spectral channels –50 to +50 channels. The non-changing pattern along ν indicates spectral aberrations suppressed by the COL. (fh). Autocorrelation cube data of (c–e), respectively. The thin cylindrical structures obtained for Δz = 125 μm and 250 μm indicates the possibility of imaging in deconvolution mode with a similar resolving power as Δz = 0 μm. (i) Depth cube data PSF(x, y, Δz) from 0 to 250 μm. Unlike a regular lens where the intensity distribution is filled, the COL generates hollow intensity distribution with four distinct lobes causing a sharp autocorrelation function. (j) The spectral and spatial cube data were combined to form 8415 spatio-spectral images corresponding to the 14 spectral channels and aberrations 0 to 250 μm in steps of 25 μm and was cross-correlated with the image corresponding to the central spatio-spectral point (2307 cm–1, 125 μm) and cross-correlation value at the origin (x=0, y=0) is plotted. The FWHM along z was ~50 μm indicating that the intensity of a plane 50 μm apart has a loss of about 50% of intensity which is ideal for 3D MIR imaging applications.
    Reconstruction results using Lucy-Richardson algorithm, Non-linear reconstruction and Lucy-Richardson-Rosen algorithm. (a) Lucy-Richardson-Rosen algorithm, O – object, OH – object hologram, PSF – point spread function, OTF – optical transfer function, × - element by element product,⊗ - 2D convolution,ℑ - Fourier transform,ℑ* - complex conjugate operation following a Fourier transform,ℑ−1- inverse Fourier transform, ~ Fourier transform of a variable, Rn and R(n+1) are the nth and (n+1)th solutions and OH was used as the initial guess solution R1, ML(O) – maximum likelihood solution of the object. (b) Direct imaging of the cross object using a visible light channel of the microscope. Average image of all the 765 spectral channels of the cross object at (c) Δz = 0. (d) Δz = 100 μm, (e) The PSF recorded for Δz = 100 μm. Reconstruction results of the cross object using (f) LRA (150 iterations), (g) NLR (α = 0, β = 0.6) and (h) LRRA (20 iterations, α = 0.2, β = 1). (i) Direct MIR imaging result of four pinholes Δz = 0. (j) Intensity pattern recorded for four pinholes for Δz = 150 μm and (k). its reconstruction result. (l) Intensity pattern recorded for four pinholes for Δz = 200 μm and (m). its reconstruction result. (n) Bar plots of RMSE and entropy for LRA, NLR and LRRA. The performance of LRRA is found to be significantly higher than LRA and NLR with RMSE ratio of 13 and 5 times, respectively. The LRRA has a rapid convergence with 7 times faster than LRA for the cross object. It must be noted that the above values are for only the cross object. The performances vary with the complexity of the object with the minimum difference for simple objects and significant difference for complicated objects. The scale bar is 50 μm.
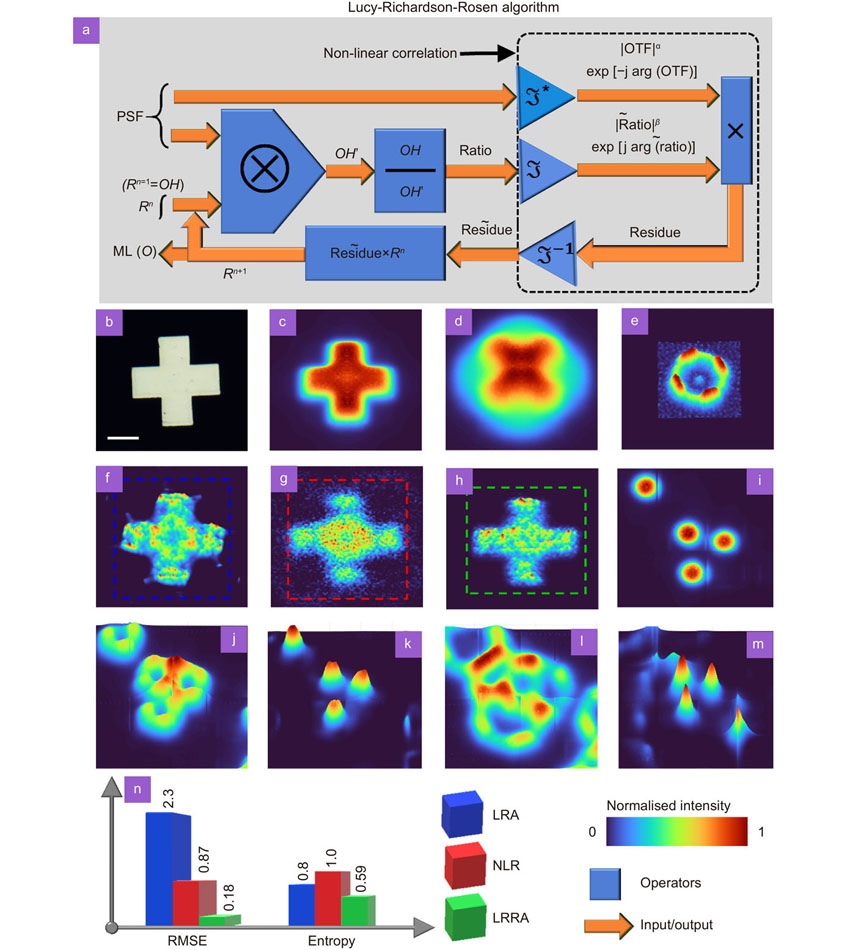
    Fig. 2. Reconstruction results using Lucy-Richardson algorithm, Non-linear reconstruction and Lucy-Richardson-Rosen algorithm. (a) Lucy-Richardson-Rosen algorithm, O – object, OH – object hologram, PSF – point spread function, OTF – optical transfer function, × - element by element product, - 2D convolution, - Fourier transform, * - complex conjugate operation following a Fourier transform, 1- inverse Fourier transform, ~ Fourier transform of a variable, Rn and R(n+1) are the nth and (n+1)th solutions and OH was used as the initial guess solution R1, ML(O) – maximum likelihood solution of the object. (b) Direct imaging of the cross object using a visible light channel of the microscope. Average image of all the 765 spectral channels of the cross object at (c) Δz = 0. (d) Δz = 100 μm, (e) The PSF recorded for Δz = 100 μm. Reconstruction results of the cross object using (f) LRA (150 iterations), (g) NLR (α = 0, β = 0.6) and (h) LRRA (20 iterations, α = 0.2, β = 1). (i) Direct MIR imaging result of four pinholes Δz = 0. (j) Intensity pattern recorded for four pinholes for Δz = 150 μm and (k). its reconstruction result. (l) Intensity pattern recorded for four pinholes for Δz = 200 μm and (m). its reconstruction result. (n) Bar plots of RMSE and entropy for LRA, NLR and LRRA. The performance of LRRA is found to be significantly higher than LRA and NLR with RMSE ratio of 13 and 5 times, respectively. The LRRA has a rapid convergence with 7 times faster than LRA for the cross object. It must be noted that the above values are for only the cross object. The performances vary with the complexity of the object with the minimum difference for simple objects and significant difference for complicated objects. The scale bar is 50 μm.
    Reconstruction results of thick and strong IR absorbing materials. (a) Normalised absorbance of the silk fiber sample. The characteristic absorption peaks are noted at 3297 cm–1 and 1600 cm–1. The spectral matrices for Δz = 0 from 1708 cm–1 to 1558 cm–1 were averaged to obtain Fig. 3(b). (b) Direct imaging of a bundle of silk threads in 3D space, showing focused and out-of-focus objects. Reconstruction result using LRRA (α = 0.5, β = 1, iterations = 18) using PSFs recorded at (c) Δz = 25 μm, (d) Δz = 50 μm and (e), Δz =75 μm. (f) Direct imaging of a bundle of silk fibers for Δz ≈ 50 μm. The magnified regions of the direct imaging and reconstruction results indicate that the LRRA could obtain a good reconstruction even for thick objects and strong IR absorbing objects. (g) Direct imaging of a single silk fiber in 3D space. (h) Reconstruction results using PSF of Δz = 50 μm. (i) Direct imaging of the single silk fiber for Δz ≈ 50 μm. (j) Normalised absorbance of the polymer material of USAF target with characteristic peaks at 1500 cm–1 and 1238 cm–1. (k) Direct imaging of the USAF object ‘3’ located at Δz ≈ 50 μm. (l) Reconstruction result of the USAF object ‘3’ using LRRA (α = 0.6, β = 1, iterations = 14). The scale bar is 50 μm. The lateral resolution of the imaging system is ~15 μm.
    Fig. 3. Reconstruction results of thick and strong IR absorbing materials. (a) Normalised absorbance of the silk fiber sample. The characteristic absorption peaks are noted at 3297 cm–1 and 1600 cm–1. The spectral matrices for Δz = 0 from 1708 cm–1 to 1558 cm–1 were averaged to obtain Fig. 3(b). (b) Direct imaging of a bundle of silk threads in 3D space, showing focused and out-of-focus objects. Reconstruction result using LRRA (α = 0.5, β = 1, iterations = 18) using PSFs recorded at (c) Δz = 25 μm, (d) Δz = 50 μm and (e), Δz =75 μm. (f) Direct imaging of a bundle of silk fibers for Δz ≈ 50 μm. The magnified regions of the direct imaging and reconstruction results indicate that the LRRA could obtain a good reconstruction even for thick objects and strong IR absorbing objects. (g) Direct imaging of a single silk fiber in 3D space. (h) Reconstruction results using PSF of Δz = 50 μm. (i) Direct imaging of the single silk fiber for Δz ≈ 50 μm. (j) Normalised absorbance of the polymer material of USAF target with characteristic peaks at 1500 cm–1 and 1238 cm–1. (k) Direct imaging of the USAF object ‘3’ located at Δz ≈ 50 μm. (l) Reconstruction result of the USAF object ‘3’ using LRRA (α = 0.6, β = 1, iterations = 14). The scale bar is 50 μm. The lateral resolution of the imaging system is ~15 μm.
    Vijayakumar Anand, Molong Han, Jovan Maksimovic, Soon Hock Ng, Tomas Katkus, Annaleise Klein, Keith Bambery, Mark J. Tobin, Jitraporn Vongsvivut, Saulius Juodkazis. Single-shot mid-infrared incoherent holography using Lucy-Richardson-Rosen algorithm[J]. Opto-Electronic Science, 2022, 1(3): 210006-1
    Download Citation