• Acta Optica Sinica
  • Vol. 39, Issue 11, 1123002 (2019)
Ying Chen1、*, Xinbei Gao1, Yangmei Xu1, Jinggang Cao1, Jinchao Xie1, Qiguang Zhu2, and Shaohua Li3
Author Affiliations
  • 1Hebei Province Key Laboratory of Test/Measurement Technology and Instrument, School of Electrical Engineering, Yanshan University, Qinhuangdao, Hebei 0 66004, China
  • 2Key Laboratory for Special Fiber and Fiber Sensor of Hebei Province, School of Information Science and Engineering, Yanshan University, Qinhuangdao, Hebei 0 66004, China
  • 3He Bei Sailhero Environmental Protection High-Tech Co., Ltd., Shijiazhuang, Hebei 0 50000, China
  • show less
    DOI: 10.3788/AOS201939.1123002 Cite this Article Set citation alerts
    Ying Chen, Xinbei Gao, Yangmei Xu, Jinggang Cao, Jinchao Xie, Qiguang Zhu, Shaohua Li. Fano Resonance-Sensing Mechanism of Photonic Crystal Nanobeam Side-Coupling Aperture Chirped Photonic Crystal Nanobeam Cavity Structure[J]. Acta Optica Sinica, 2019, 39(11): 1123002 Copy Citation Text show less
    Structural diagram of PCN side-coupling aperture chirped PCNC
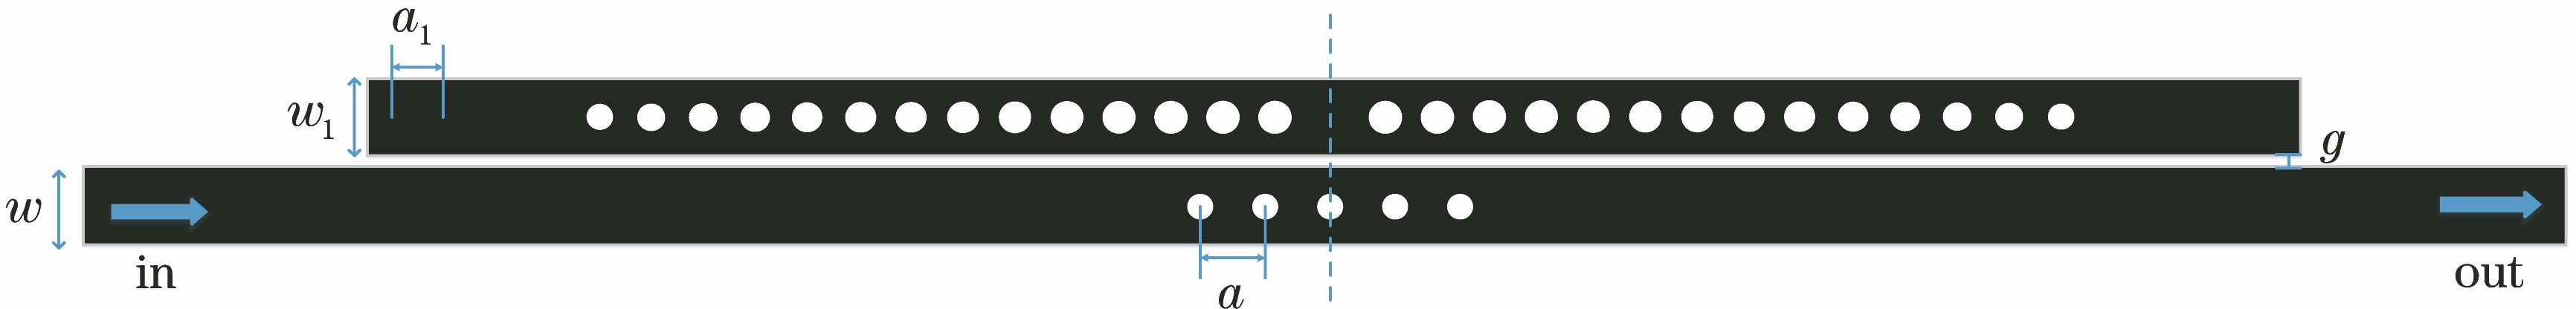
    Fig. 1. Structural diagram of PCN side-coupling aperture chirped PCNC
    Diagrams of structure and simplified model. (a) Diagram of Fano resonance structure; (b) simplified diagram of theoretical model
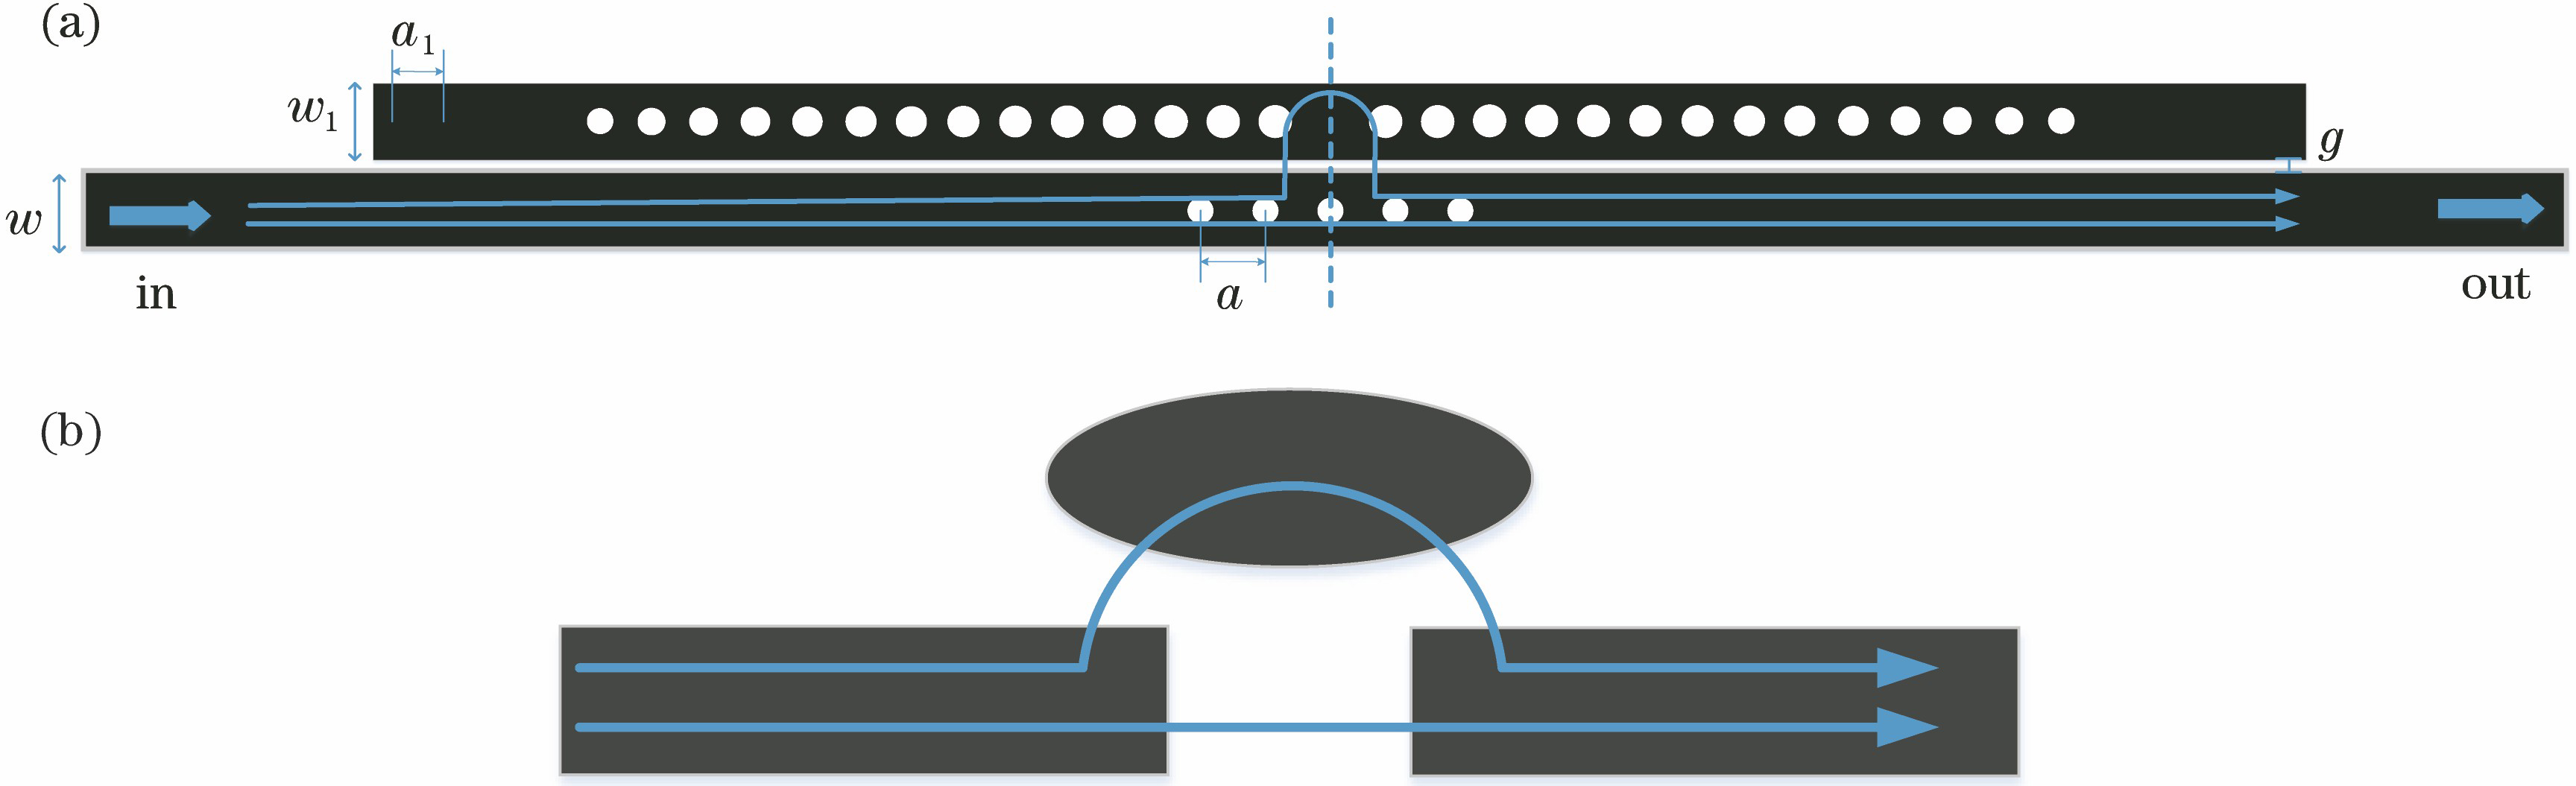
    Fig. 2. Diagrams of structure and simplified model. (a) Diagram of Fano resonance structure; (b) simplified diagram of theoretical model
    Diagrams of Fano resonance line and field distribution. (a) Fano resonance line; (b) electromagnetic field distribution at the trough; (c) electromagnetic field distribution at the peak
    Fig. 3. Diagrams of Fano resonance line and field distribution. (a) Fano resonance line; (b) electromagnetic field distribution at the trough; (c) electromagnetic field distribution at the peak
    FOM values corresponding to Fano resonances at different wavelengths
    Fig. 4. FOM values corresponding to Fano resonances at different wavelengths
    Effect of r on sensor performance. (a) Effect of r on Fano resonance; (b) effect of r on FOM value; (c) effect of r on sensitivity
    Fig. 5. Effect of r on sensor performance. (a) Effect of r on Fano resonance; (b) effect of r on FOM value; (c) effect of r on sensitivity
    Effect of a on sensor performance. (a) Effect of a on Fano resonance; (b) effect of a on FOM value; (c) effect of a on sensitivity
    Fig. 6. Effect of a on sensor performance. (a) Effect of a on Fano resonance; (b) effect of a on FOM value; (c) effect of a on sensitivity
    Effect of g on sensor performance. (a) Effect of g on Fano resonance; (b) effect of g on FOM value; (c) effect of g on sensitivity
    Fig. 7. Effect of g on sensor performance. (a) Effect of g on Fano resonance; (b) effect of g on FOM value; (c) effect of g on sensitivity
    Comparison of FOM values of three structures
    Fig. 8. Comparison of FOM values of three structures
    Influence of refractive index n on sensing characteristics. (a) Influence of refractive index n on Fano resonance peak; (b) fitting curve of relationship between refractive index n and resonant wavelength
    Fig. 9. Influence of refractive index n on sensing characteristics. (a) Influence of refractive index n on Fano resonance peak; (b) fitting curve of relationship between refractive index n and resonant wavelength
    Ying Chen, Xinbei Gao, Yangmei Xu, Jinggang Cao, Jinchao Xie, Qiguang Zhu, Shaohua Li. Fano Resonance-Sensing Mechanism of Photonic Crystal Nanobeam Side-Coupling Aperture Chirped Photonic Crystal Nanobeam Cavity Structure[J]. Acta Optica Sinica, 2019, 39(11): 1123002
    Download Citation