• Chinese Optics Letters
  • Vol. 13, Issue 3, 031001 (2015)
剑 王1、2, 宗清 赵2、*, 卫华 何2, 斌 朱2, 克攻 董2, 玉迟 吴2, 天奎 张2, 牛 高2, 凯南 周2, 娜 谢2, 维民 周2, and 渝秋 谷2
Author Affiliations
  • 1Department of Physics, Fudan University, Shanghai 210433, China
  • 2Research Center of Laser Fusion, China Academy of Engineering Physics, Mianyang 621900, China
  • show less
    DOI: 10.3788/COL201513.031001 Cite this Article Set citation alerts
    剑 王, 宗清 赵, 卫华 何, 斌 朱, 克攻 董, 玉迟 吴, 天奎 张, 牛 高, 凯南 周, 娜 谢, 维民 周, 渝秋 谷. Radiography of a Kα X-ray source generated through ultrahigh picosecond laser–nanostructure target interaction[J]. Chinese Optics Letters, 2015, 13(3): 031001 Copy Citation Text show less
    (a) Schematic overview of the experiment setup. L–N means the laser is interacting with the nanowire structure directly. L–S means the laser is interacting with the substrate; (b) scanning electron microscopy image of the nanowire array target.
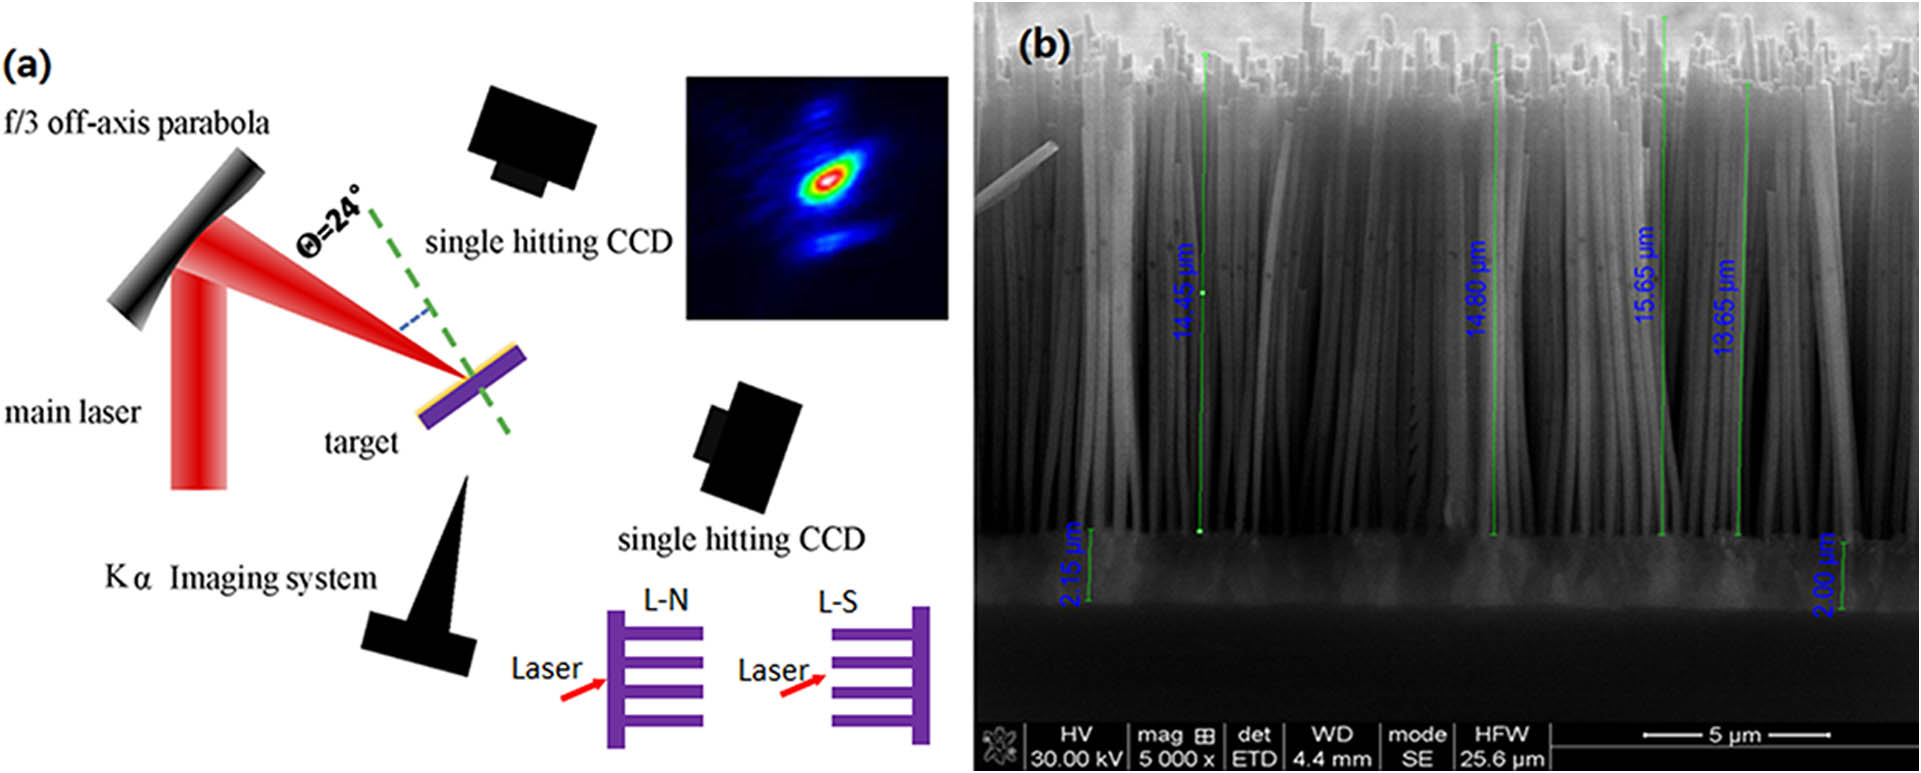
    Fig. 1. (a) Schematic overview of the experiment setup. L–N means the laser is interacting with the nanowire structure directly. L–S means the laser is interacting with the substrate; (b) scanning electron microscopy image of the nanowire array target.
    (a) Spectrum of K-shell lines obtained for 94.8 J laser incidence on the target with 20 μm nanowires; (b) dependence of the total count of Kα on the laser energy for the target with 20 μm nanowires.
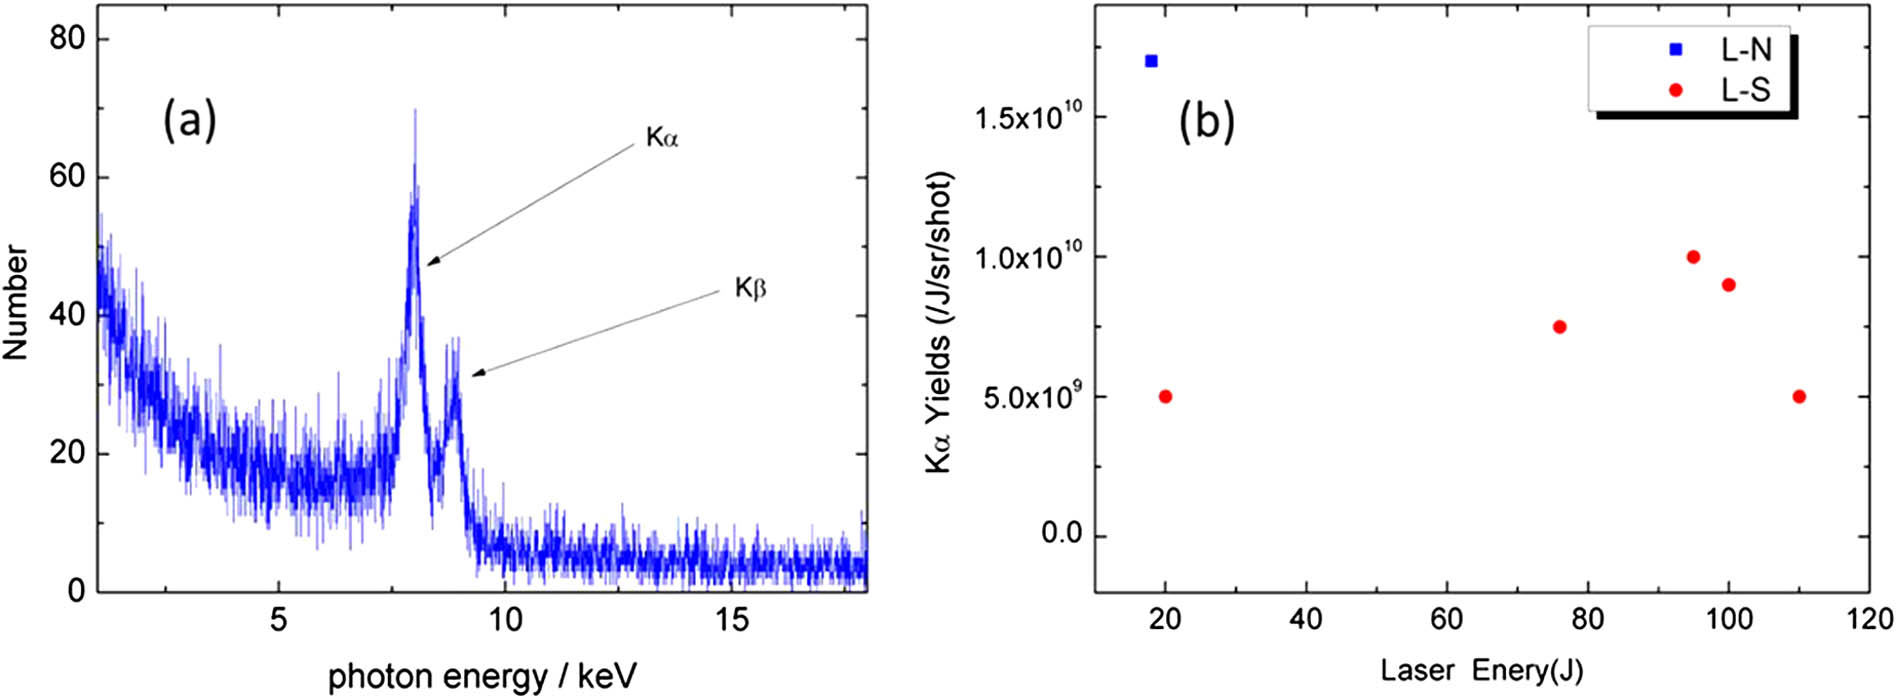
    Fig. 2. (a) Spectrum of K-shell lines obtained for 94.8 J laser incidence on the target with 20 μm nanowires; (b) dependence of the total count of Kα on the laser energy for the target with 20 μm nanowires.
    (a) Original Kα image for a nanowire array target with 10 μm long nanowires and a 5 μm thick substrate. Corresponding laser peak intensity is 1×10¹⁹ W/cm2; (b) restored image from (a).
    Fig. 3. (a) Original Kα image for a nanowire array target with 10 μm long nanowires and a 5 μm thick substrate. Corresponding laser peak intensity is 1×10¹⁹W/cm2; (b) restored image from (a).
    (a) Stack of 1D slits (50, 100, 200, and 300 μm) on a 50 μm thick Ta substrate; (b) horizontal line-outs for the point projection radiography.
    Fig. 4. (a) Stack of 1D slits (50, 100, 200, and 300 μm) on a 50 μm thick Ta substrate; (b) horizontal line-outs for the point projection radiography.
    Laser Energy (J)FWHM of the Point Spread Function (μm)CE
    1943.82.4×104
    7548.91.2×104
    9446.41.6×104
    Table 1. Laser Energy versus FWHM of the PSF and CE
    剑 王, 宗清 赵, 卫华 何, 斌 朱, 克攻 董, 玉迟 吴, 天奎 张, 牛 高, 凯南 周, 娜 谢, 维民 周, 渝秋 谷. Radiography of a Kα X-ray source generated through ultrahigh picosecond laser–nanostructure target interaction[J]. Chinese Optics Letters, 2015, 13(3): 031001
    Download Citation