
Marco Hornung, Hartmut Liebetrau, Andreas Seidel, Sebastian Keppler, Alexander Kessler, Jorg Korner, Marco Hellwing, Frank Schorcht, Diethard Klopfel, Ajay K. Arunachalam, Georg A. Becker, Alexander Savert, Jens Polz, Joachim Hein, and Malte C. Kaluza, "The all-diode-pumped laser system POLARIS-an experimentalist’s tool generating ultra-high contrast pulses with high energy," High Power Laser Sci. Eng. 2, 03000e20 (2014)
- High Power Laser Science and Engineering
- Vol. 2, Issue 3, 03000e20 (2014)
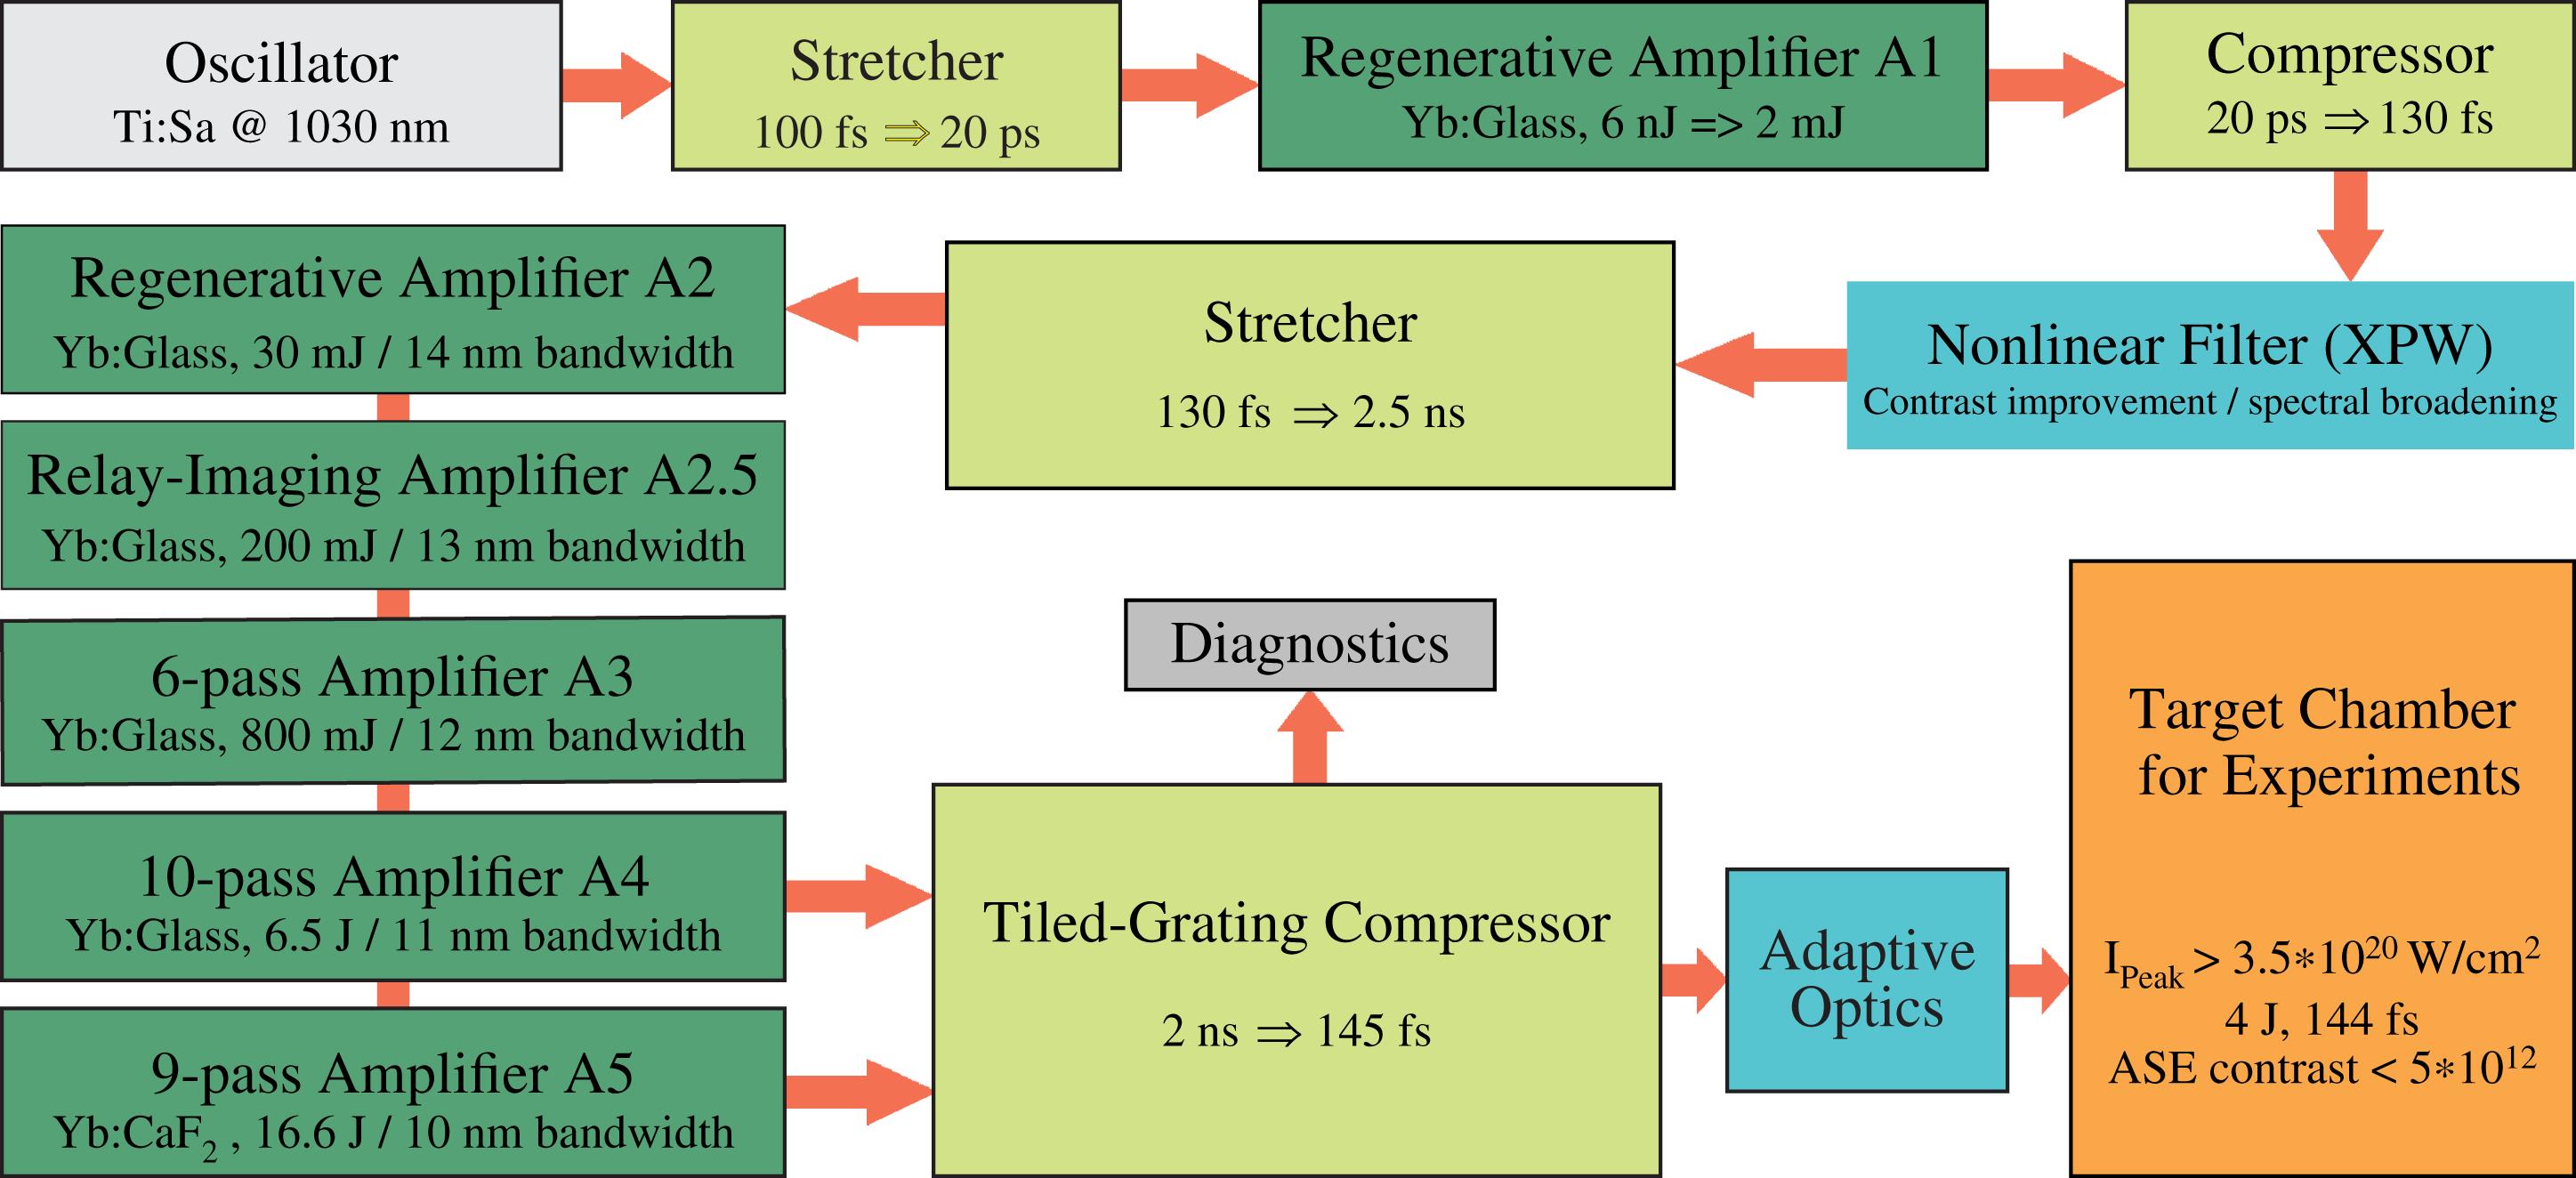
Fig. 1. Schematic overview of the POLARIS laser system. An oscillator and two stretcher–compressor stages are used together with six amplifiers (green boxes). A nonlinear filter based on XPW broadens the spectrum and enhances the temporal contrast. An adaptive optics system is used to flatten the wavefront before the pulses enter the target chamber for focusing.
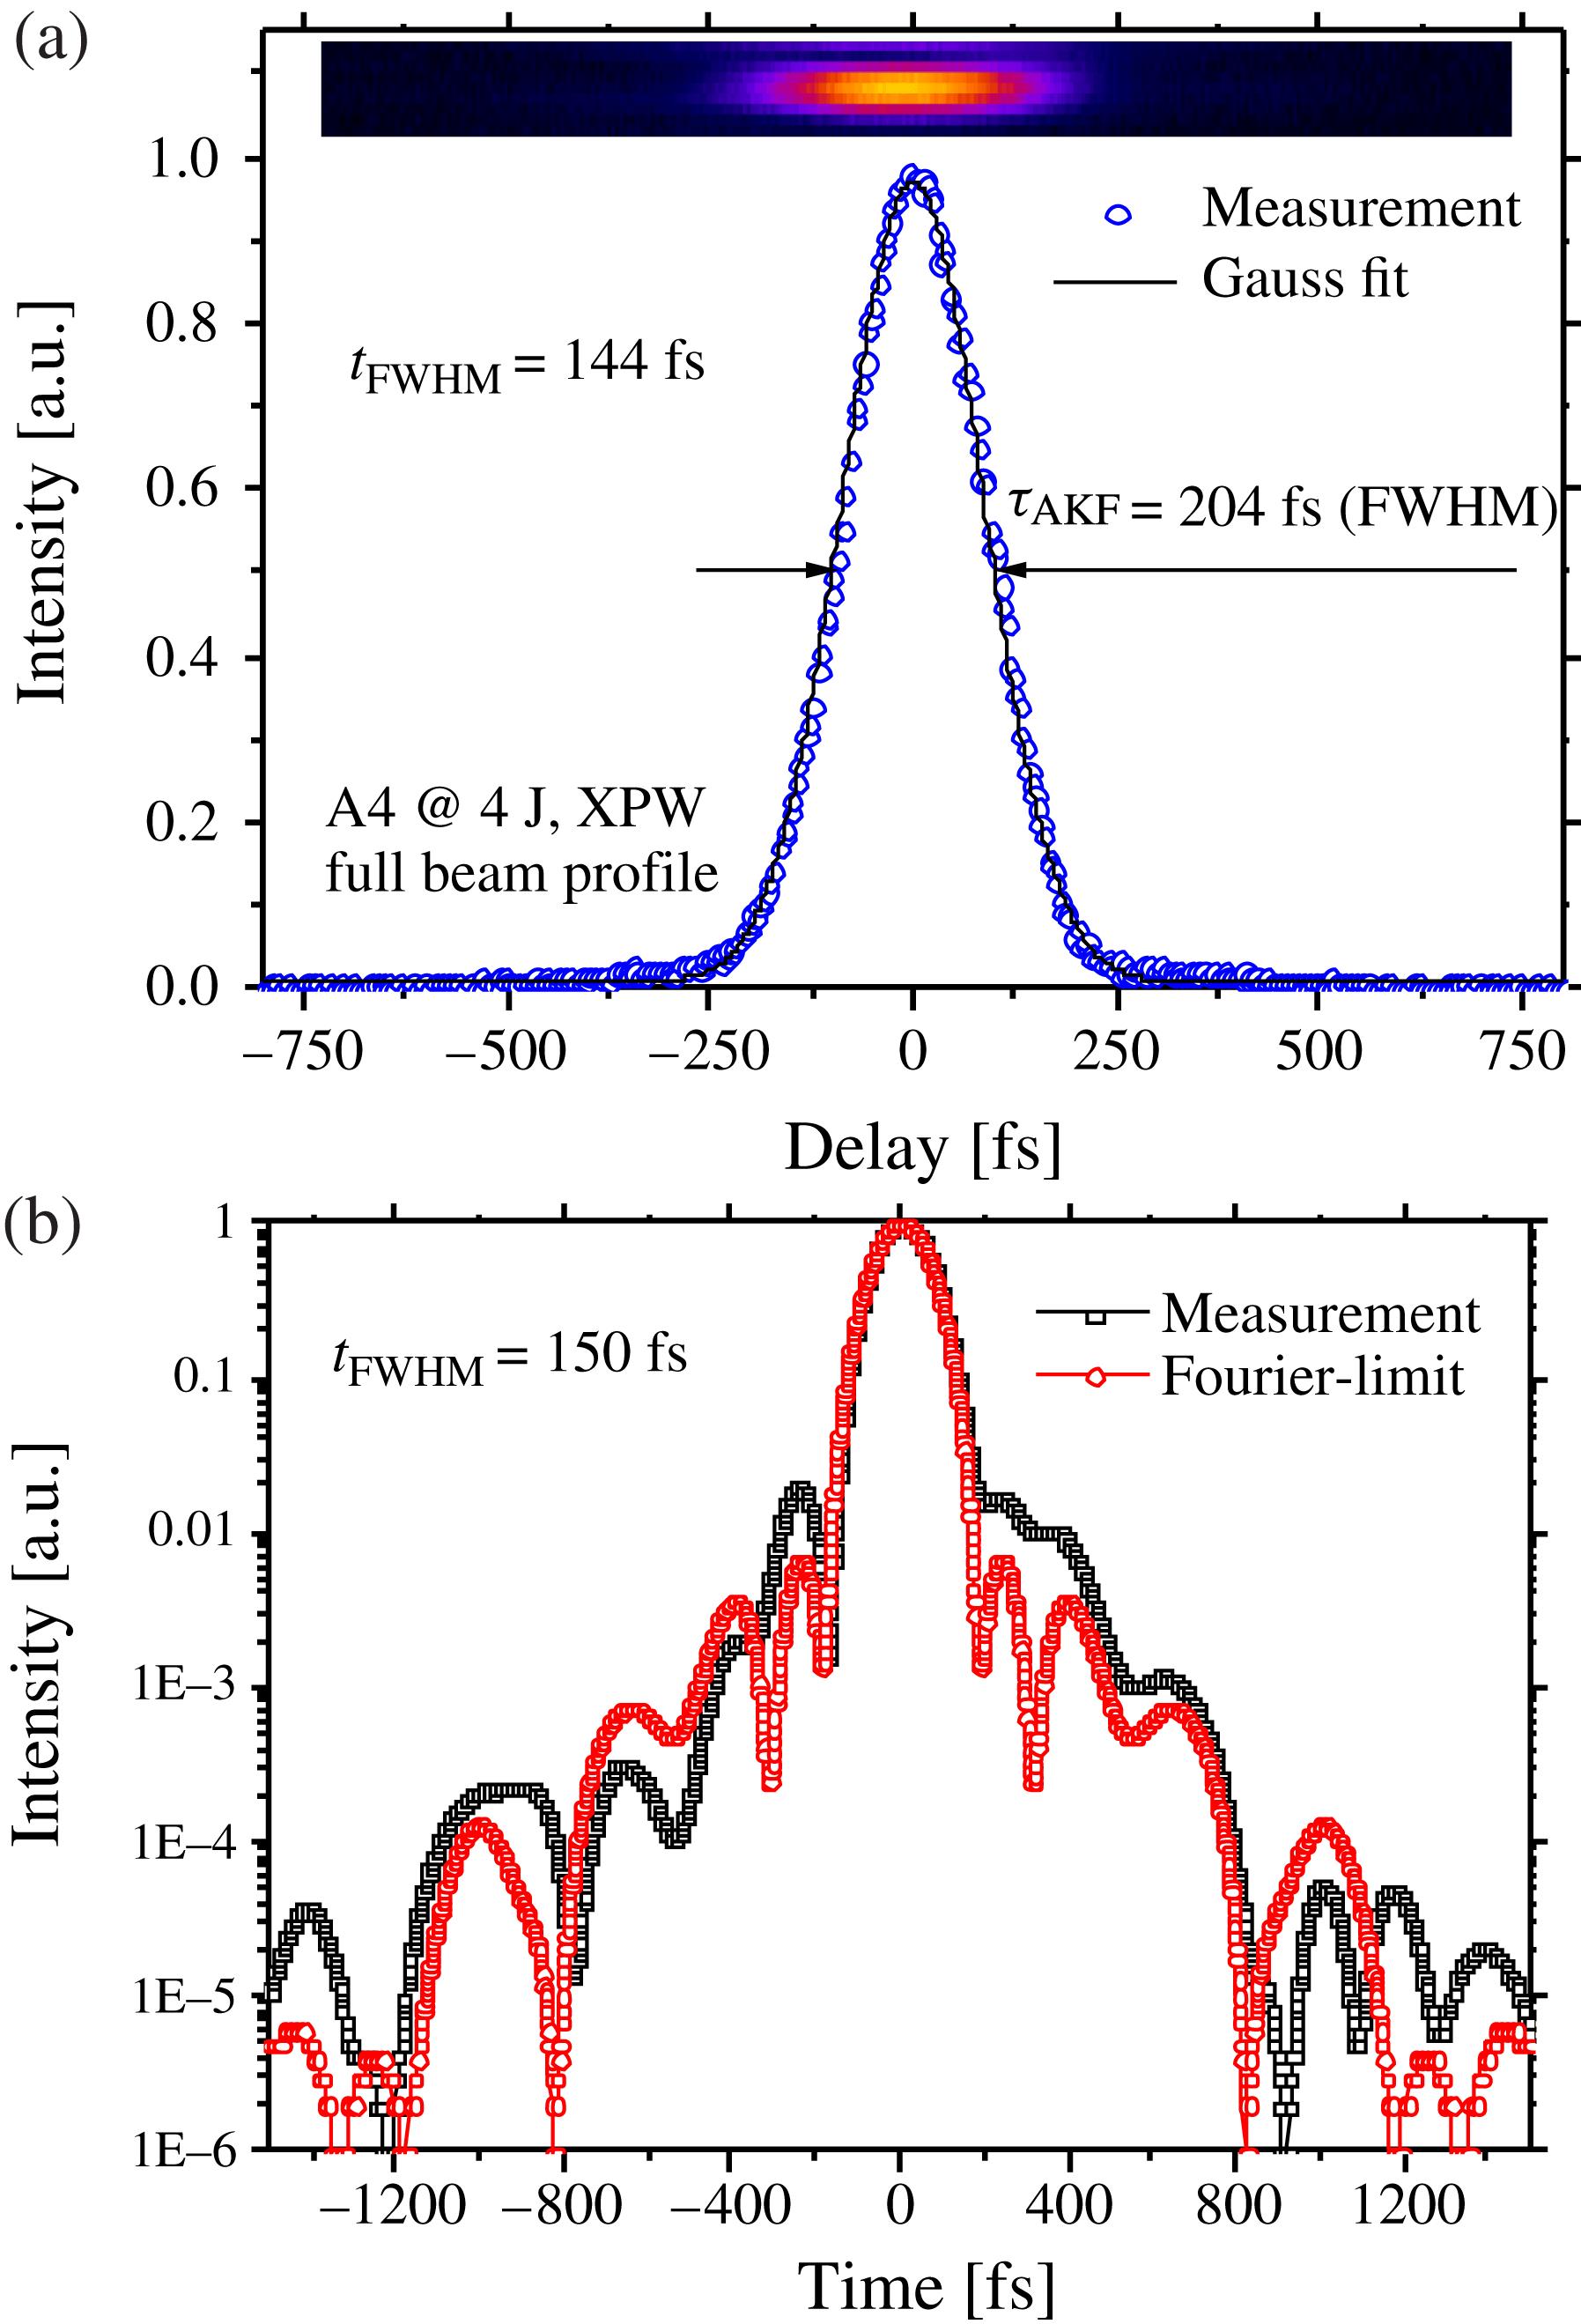
Fig. 2. Pulse duration measurements of the compressed pulses. (a) Second-order autocorrelation of a 4 J pulse energy laser pulse which was amplified with A4. A Gaussian distribution fits well to the measured data. Blue: measurement, black: Gaussian fit. (b) High-dynamic Wizzler measurement of the A2 pulses (10 mJ pulse energy). Black: measurement, red: Fourier-limit.
Fig. 3. Measurements of the near-field intensity distribution of the amplified laser pulses. (a) Beam profile of the fourth amplifier (A4) measured in front of the focusing parabola after pulse compression. (b) Beam profile of the fifth amplifier (A5) measured directly after amplification with a pulse energy of 16.6 J.
Fig. 4. Measured transverse far-field profile of the A4-amplified and compressed laser pulses. The area within which the intensity is larger than  is
is  and contains
  of the pulse energy (
 ).
).
is and contains of the pulse energy (). Fig. 5. High-dynamic temporal characterization of the amplified and compressed laser pulses. The intensity is given as the relative on-target intensity using  -focusing and negative times are defined as the times before the laser pulse. The laser pulse is characterized using different measurements: red: Self-Referenced Spectral Interferometry (Wizzler), green: SHG-correlator, pink: THG-correlator, blue and dark blue: photodiode. The detection limit of each measurement is marked as a dashed line.
-focusing and negative times are defined as the times before the laser pulse. The laser pulse is characterized using different measurements: red: Self-Referenced Spectral Interferometry (Wizzler), green: SHG-correlator, pink: THG-correlator, blue and dark blue: photodiode. The detection limit of each measurement is marked as a dashed line. Fig. 6. Stability measurements. (a) Pulse duration measurement with a single-shot SHG-autocorrelator during 300 consecutive full energy shots (taken over 3.3 h). (b) Cutoff energy of TNSA-accelerated protons from a  -thick copper foil versus shot number (30 consecutive shots).
-thick copper foil versus shot number (30 consecutive shots). 

Set citation alerts for the article
Please enter your email address

© Copyright 2018-2021 | Chinese Laser Press. All Rights Reserved 沪ICP备15018463号-20