
Marco Hornung, Hartmut Liebetrau, Andreas Seidel, Sebastian Keppler, Alexander Kessler, Jorg Korner, Marco Hellwing, Frank Schorcht, Diethard Klopfel, Ajay K. Arunachalam, Georg A. Becker, Alexander Savert, Jens Polz, Joachim Hein, and Malte C. Kaluza, "The all-diode-pumped laser system POLARIS-an experimentalist’s tool generating ultra-high contrast pulses with high energy," High Power Laser Sci. Eng. 2, 03000e20 (2014)
- High Power Laser Science and Engineering
- Vol. 2, Issue 3, 03000e20 (2014)
Abstract
Keywords
1. Introduction
Chirped-pulse amplification (CPA[ are widely used to study laser–matter interactions. During the past three decades this field of science has been growing rapidly and it has been shown that the laser performance in terms of pulse duration, pulse energy, and temporal intensity contrast strongly affects the experimental results. Experiments of particular interest are electron[
However, for more than one decade strong efforts have been made to establish diode-pumped solid-sate laser (DPSSL) technology for generating high-energy femtosecond or picosecond laser pulses[ -doped amplification media have already been used for the amplification of ns-laser pulses to energies in excess of 10 J, as recently shown in the projects LUCIA (Yb:YAG, 14 J[
At the Helmholtz-Institute and the Institute of Optics and Quantum Electronics in Jena, Germany, the POLARIS laser system[ focal-spot size, and a temporal contrast for the amplified spontaneous emission (ASE) of
  . With these parameters, a peak intensity of
  is available for experiments. To the best of our knowledge POLARIS is currently the most powerful and intense diode-pumped laser system. Nevertheless, the laser is still under continued development in order to further increase the pulse energy, decrease the pulse duration, and to better meet the requirements of experiments.
Sign up for High Power Laser Science and Engineering TOC. Get the latest issue of High Power Laser Science and Engineering delivered right to you!Sign up now
In this paper we describe the architecture of POLARIS, including the recently commissioned amplifier A5[
2. Architecture of the POLARIS laser
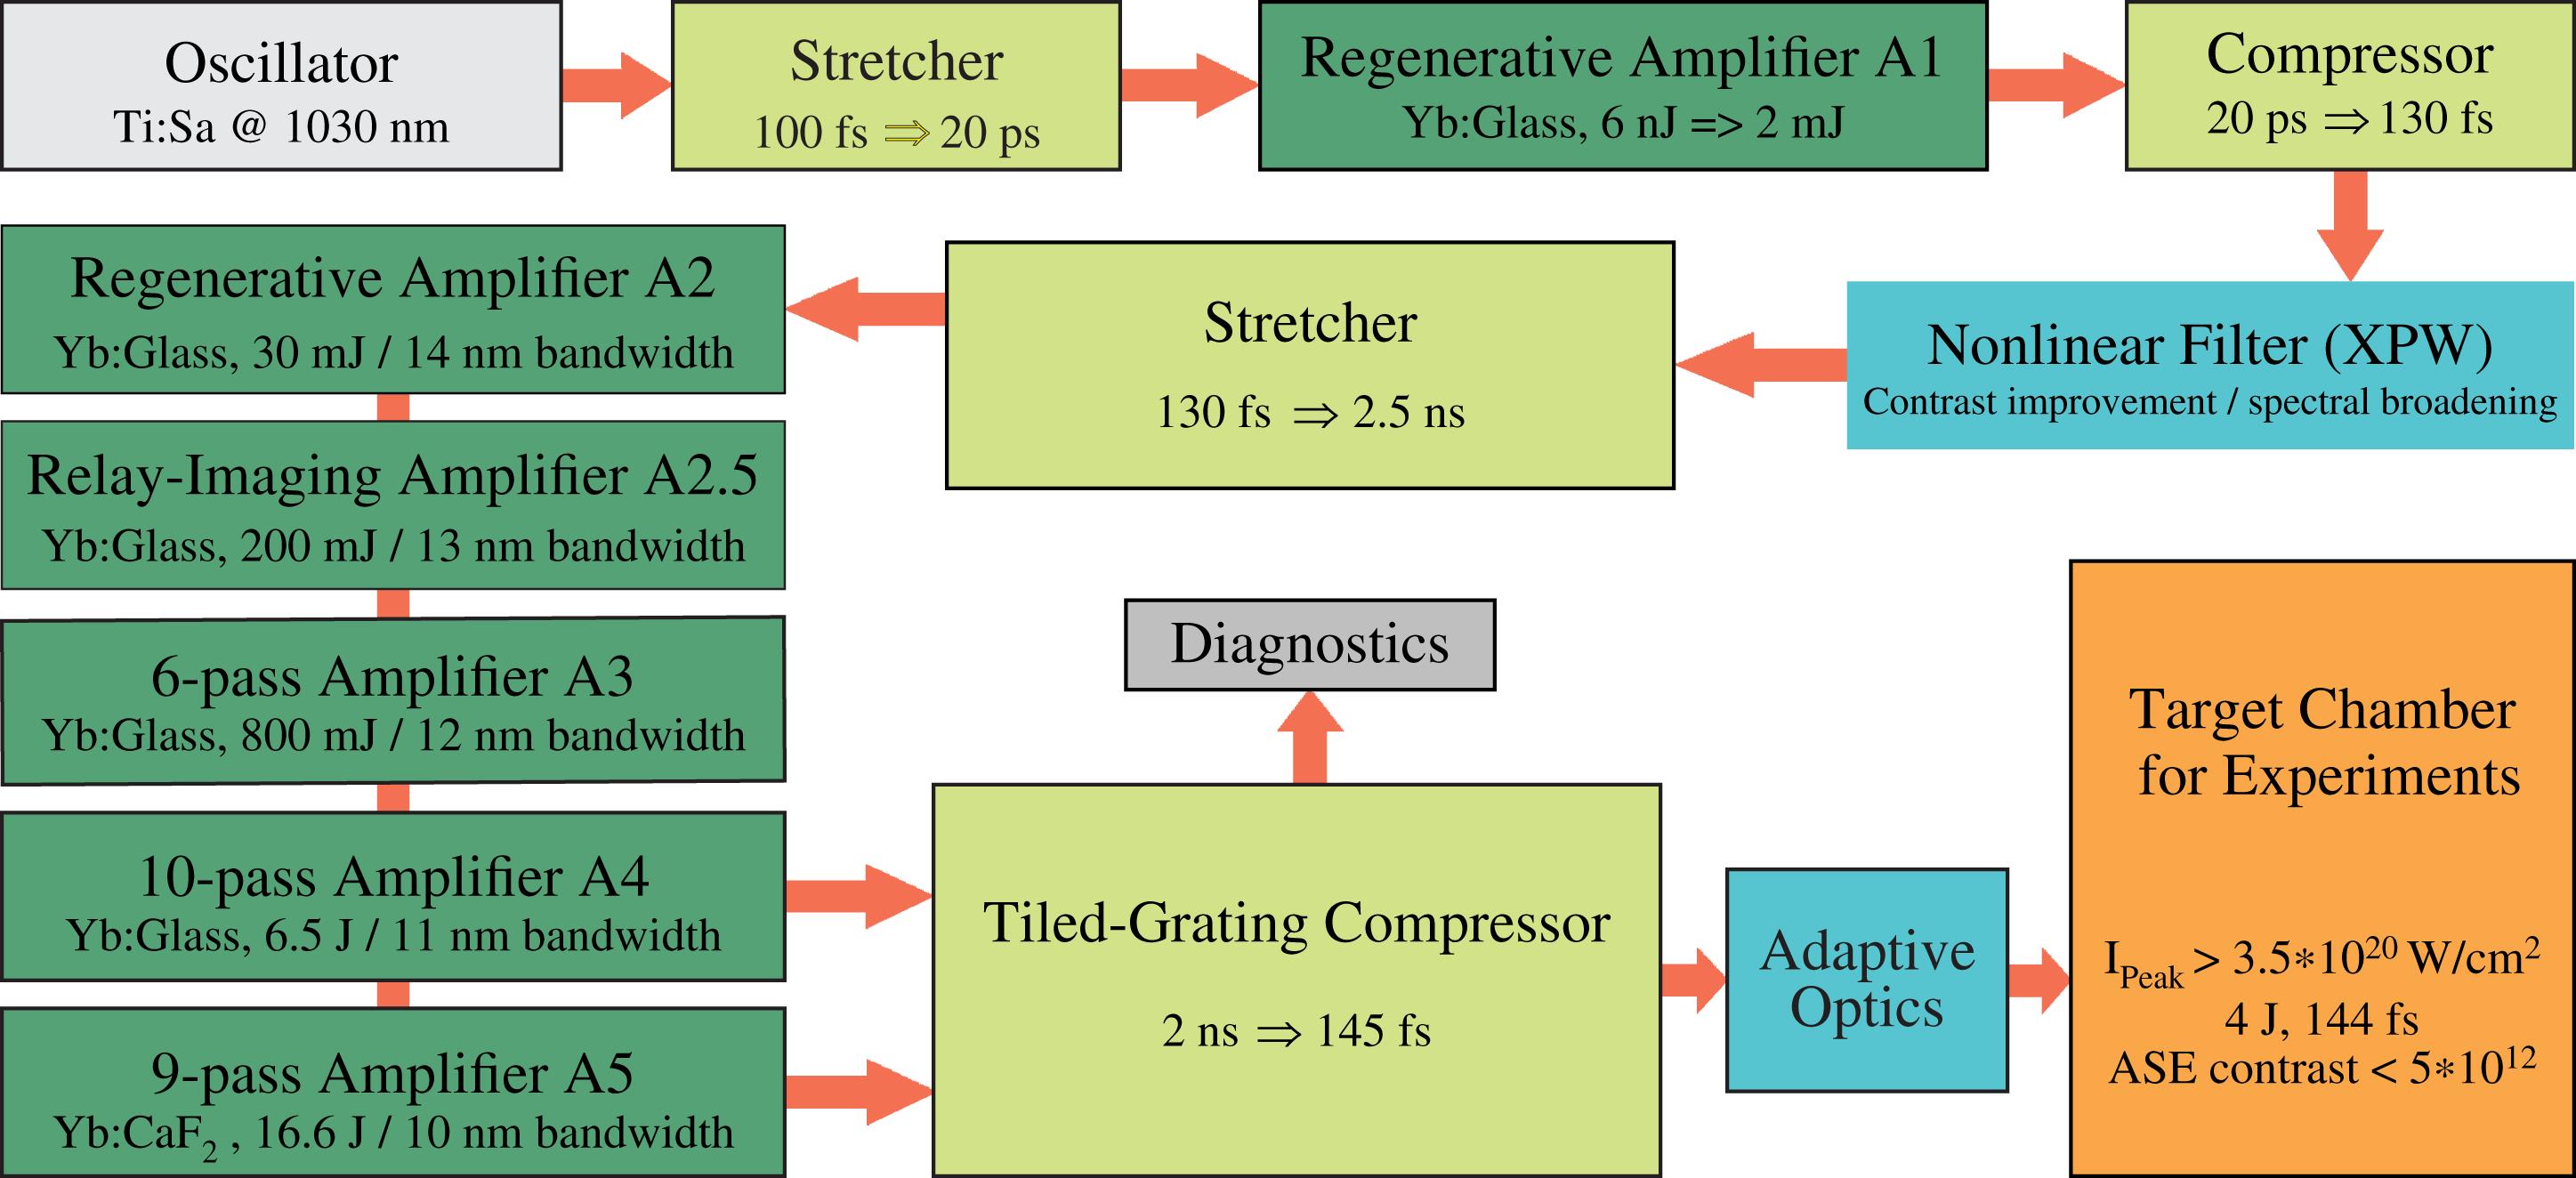
In Figure
After pulse compression a radiation-shielded bunker with a target chamber is available for experiments. The seed pulses for the laser chain are generated in a commercial mode-locked Ti:sapphire oscillator (Coherent MIRA 900) running at a central wavelength of 1030 nm with a pulse energy of 7 nJ and a spectral bandwidth of 20 nm (FWHM). Before entering the first regenerative amplifier the pulses are temporally stretched to 20 ps. The amplifier A1 increases the pulse energy to 2 mJ. Afterwards the pulses are re-compressed to 130 fs before they enter the nonlinear XPW-filter realized by a  -crystal.
The contrast-cleaned pulses are then stretched once more by the second stretcher (cf. [ and furtheramplified by the second regenerative amplifier A2 to a pulse energy of
  . The amplification to the Joule-level is accomplished with a relay-imaging amplifier (A2.5:
  ) and two multipass non-imaging amplifiers (A3:
  [
[ ). In all of these amplifiers
  -doped fluoride-phosphate glass[
The amplified pulses can then either be sent to the main compressor or used as a seed for the final amplifier A5. This amplifier uses  in a nine-pass configuration as the active material[
For all the experiments shown here, only pulses amplified up to A4 were used. They were compressed with a tiled-grating compressor[ parabola, a peak intensity in excess of
  is available.
3. Double-CPA and XPW for temporal contrast improvement and spectral broadening
Since the temporal intensity contrast has been shown to be one of the most important parameters for the laser’s successful application in high-intensity experiments, we have continuously optimized the contrast of POLARIS. To apply a nonlinear filtering via XPW generation for contrast improvement, the front end was extended by the above-mentioned picosecond-CPA stage.
The two-pass Öffner-type stretcher consists of a  gold grating with a line density of 1200 lines per mm, a 50.8 mm concave mirror with a focal length of 200 mm, and a convex mirror with a focal length of
  . Back reflection from a hollow-roof mirror accomplishes the second pass. Due to the small stretching factor the footprint of the whole setup is only
  .
.
In the subsequent regenerative amplifier A1 the stretched 20 ps pulses are amplified up to energies of 3 mJ without any spectral distortion due to self-phase modulation. The output spectrum of the amplifier has a bandwidth (FWHM) of  , supporting a re-compressed pulse duration of
  if bandwidth-limited Gaussian pulses are assumed. To avoid the generation of post- and pre-pulses the round-trip time of the amplifier was matched to the pulse repetition time of the oscillator[
Because the nonlinear filter requires an unstreched bandwidth-limited input, the pulse has to be re-compressed after amplification in A1. The compression is achieved by a grating compressor, which consists of two gold gratings similar to the one in the stretcher. The gratings are separated by  and again a hollow-roof mirror is used for the second pass. The compressor can be operated in air. Pulses with a duration of 130 fs, which is the bandwidth limit of the amplified spectral intensity profile, are achieved.
After this compression the pulse is sent to the XPW-stage, where a  thick holographic cut
  -crystal is used as the nonlinear element. The beam is focused and recollimated with two lenses, both of them having a focal length of
  . The
. The  -crystal can be rotated around its surface normal for the XPW optimization.
In order to adjust the required intensity the crystal is placed slightly behind the focal plane. Placing the whole focused beam between the two lenses, including the crystal and its mount, in a vacuum chamber avoids nonlinear effects in air. To separate the XPW and the input signal the setup is placed between two crossed polarizers with a extinction ratio better than  . Thus, considering a
  conversion efficiency, an increase of the intensity contrast of more than four orders of magnitude is achievable.
The generated cross-polarized signal beam exhibits a  -mode with a maximum pulse energy of
  , and a spectral bandwidth of
  (FWHM). It is used in the following as the seed for the remaining amplifier chain after passing the main ns-stretcher (Figure
4. Pulse duration measurements
In this section we present the temporal properties of the final compressed laser pulses.
In Figure  is measured over the full beam profile. It fits well to a Gaussian pulse shape (black line). The broader spectrum of the XPW (cf. [
 to currently
  . In the former setup only a conventional, single-stage CPA layout was implemented.
In Figure  pulse energy is shown. For this measurement a self-referenced spectral interferometer (Wizzler) was used and the spectral phase was flattened using a Dazzler (both Fastlite Techn.) positioned directly behind the oscillator without using the XPW-stage. This measurement highlights the capability of generating nearly transform-limited laser pulses with high temporal contrast. However, in order to use the Dazzler’s spectral shaping capability together with the XPW-cleaned pulses the device needs to be inserted behind the XPW-stage.
5. Spatial pulse characterization
A homogeneous super-Gaussian-like near-field profile of the laser pulses is desirable for an efficient energy extraction and a maximum compressor throughput. The maximum extractable pulse energy of the main amplifiers A4 and A5 is limited by the fluence threshold at which laser-induced damage occurs on the surface or in the volume of the active material. The Yb:glass, which is used in amplifier A4, withstands a fluence of  in long-term operation, whereas the fluence on the
  -crystal used in amplifier A5 is currently limited by the damage threshold of the AR coatings to
  . In Figure
The measurement for the A4-amplified pulse in Figure  magnification telescope. The enlarged beam diameter ensures a safe operation in terms of laser-induced damage of the compressor gratings (
 ).
).
The beam profile of the A5-amplified pulses, shown in Figure  magnification telescope is placed between the amplifier A5 and the pulse compressor.
To generate a high peak intensity for laser–matter experiments the pulses are focused in the target chamber with an off-axis parabola ( ,
,  , cf. Figure
For the improvement of the focusability of the pulses from A4 we installed an adaptive optics system. The combination of a 160-mm-diameter adaptive mirror and a wavefront sensor helps to flatten the wavefront and to reduce the focal-spot size as well as to increase the energy content within the focal-spot area (for details see [
The focal spot of the amplified laser pulses is shown in Figure  (
( ) is
) is  and contains
  of the total laser pulse energy (
 ). The Strehl ratio, defined as the ratio of the achieved peak intensity to the calculated peak intensity assuming a flat wavefront, is 0.45 and likely limited by residual chromatic and wavefront aberrations.
6. High-dynamic temporal pulse characterization
As mentioned in the introduction, the temporal intensity contrast is one of the most important parameters for the application of high-intensity laser pulses in experiments. In this section we will quantify the temporal contrast by giving an overview of the temporal behaviour of the compressed pulses on different timescales with a high-dynamic range.
In Figure  -focusing parabola currently installed in our target chamber. Due to the different methods used, the characterization spans both a range of 17 orders of magnitude for the relative intensity and a time-window from femtoseconds to milliseconds. The individual detection limits for each individual measurement are indicated by dashed lines in the corresponding colours.
The red (Wizzler) and green (SHG-autocorrelation) curves in Figure
To further resolve the temporal structure of the compressed laser pulses a commercial third-order cross-correlator (Sequoia, Amplitude Technologies) has been used. It is able to resolve 10 orders of magnitude relative intensity for pulses centred at  . Here we mention that the measurement with the Sequoia is taken in the near-field of the compressed pulse and since we are using a tiled-grating compressor some spectral components of the pulses are missing depending on the lateral position in the laser pulse[
However, even the dynamic range of the third-order cross-correlator is not sufficient to resolve the relative intensity contrast of our pulses when using the XPW front end. Apart from some residual pre-pulses, the relative contrast ratio of the pulses can no longer be resolved for  before the main pulse due to the detection limit of
  for the relative intensity contrast. The residual pre-pulses are likely generated by reflections inside the amplifier chain[
The ASE of the amplifiers was measured by operating the laser with fully pumped amplifiers, but blocking pulses from the oscillator. Due to the non-saturated amplification within all amplifiers of POLARIS the generated ASE without seed is identical to the ASE generated during the amplification. Using a high-sensitivity photodiode and calibrated ND filters we are able to measure the temporally dependent relative intensity of the ASE. Furthermore, with our focal-spot diagnostic we could record the spatial far-field distribution of the ASE contributions from the different amplifiers, finally leading to the relative ASE intensities on target. This method is described in detail in[
Due to its architecture the POLARIS laser emits two different types of ASE. The first is the so-called front-end ASE which is generated in the first amplifier (A1), reduced by the XPW-stage but further amplified by the second amplifier, with a pulse duration of  , which corresponds to the round-trip times in the regenerative amplifiers. The blue curve in Figure
  relative to the main pulse.
The second part is the so-called multipass-ASE, which is generated in the multipass amplifiers A2.5, A3, and A4. Due to their multipass architecture, which does not implement a cavity, the pulse duration is on the order of a few milliseconds. This corresponds to the pump duration and the fluorescence lifetime of the active material.
Note that the front-end ASE is also amplified in the multipass amplifiers since this front-end ASE is seeding – together with the main laser pulse – all subsequent amplifiers. Due to the long pulse duration of  , the multipass-ASE energy and intensity can be significantly decreased by temporal gating of the main laser pulse during the amplification. This is accomplished by two Pockels cells, which are installed before and after the amplifier A4. Their gate duration is set to be as short as
  .
.
The relative intensity of the multipass-ASE with respect to the main pulse is  and displayed in Figure
Additionally, we measured the energy of the ASE to be  , which is the sum of all contributions. Compared to an ASE energy of
  and a relative ASE intensity of
  of our conventional and formerly used front end (without XPW, cf. [
 before the main laser pulse a contrast of
  (relative intensity of
  ), and up to
  a temporal intensity contrast of
  (relative intensity of
  ) has been achieved.
7. Experimental performance
With the currently installed  -focusing parabola the POLARIS laser is capable of delivering a peak intensity of
  with a repetition rate of
  . The pulses are as short as
  , with a pulse energy of
  on target.
With the final commissioning of amplifier A5, the on-target pulse energy will likely exceed  [
[
Up to now we have performed several experimental campaigns over the past two years in order to accelerate protons or electrons. As an example, protons have been accelerated from thin foils by the so-called target-normal sheath acceleration (TNSA[ while measuring the cutoff energy of the accelerated protons. In Figure
  -thick copper foil was used as target and an average proton energy of
  was achieved. While keeping all parameters constant during these 30 shots the standard deviation for the measured proton energy was as small as
  . Note that for our parameters the proton cutoff energy only weakly depends on the pulse duration[
8. Conclusion and outlook
In conclusion we present an overview of the fully diode-pumped solid-state laser POLARIS. With a peak intensity of  it is currently, to the best of our knowledge, the most intense DPSSL worldwide. Moreover, the pulses are generated with an ultra-high temporal contrast of
  for the ASE of the laser system.
Furthermore, we have shown that the pulse energy can be increased with a diode-pumped  -crystal to
  . In the near future, the pulses from this amplification stage will be compressed and focused to be available for high-intensity laser–matter experiments.
Finally, we investigate the operation performance of POLARIS in laser–matter interaction experiments, where a stable generation of protons has been achieved with a standard deviation of  for the cutoff energy.
References
[1] D. Strickland, G. Mourou. Opt. Comm., 56, 219(1985).
[2] E. Esarey, C. B. Schroeder, W. P. Leemans. Rev. Mod. Phys., 81, 1229(2009).
[4] A. Macchi, M. Borghesi, M. Passoni. Rev. Mod. Phys., 85, 751(2013).
[6] Y. Izawa, N. Miyanaga, J. Kawanaka, K. Yamakawa. J. Opt. Soc. Korea, 12, 178(2008).
[7] H. Johnston. Physicsworld, 26, 50(2013).
[11] A. Bayramian, P. Armstrong, E. Ault, R. Beach, C. Bibeau, J. Caird, R. Campbell, B. Chai, J. Dawson, C. Ebbers, A. Erlandson, Y. Fei, B. Freitas, R. Kent, Z. Liao, T. Ladran, J. Menapace, B. Molander, S. Payne, N. Peterson, M. Randles, K. Schaffers, S. Sutton, J. Tassano, S. Telford, E. Utterback. J. Fusion Sci. Technol., 52, 383(2007).
[12] T. Töpfer, J. Neukum, J. Hein, M. Siebold. Laser Focus World, 46, 64(2010).
[19] T. Töpfer, J. Hein, J. Philipps, D. Ehrt, R. Sauerbrey. Appl. Phys. B, 71, 203(2000).
[20] T. Töpfer, J. Hein, W. Wintzer, D. Ehrt, R. Sauerbrey. Glass Sci. Technol., 75, 223(2002).
[21] D. Ehrt. Curr. Opin. Solid State Mater. Sci., 7, 135(2003).


Set citation alerts for the article
Please enter your email address

© Copyright 2018-2021 | Chinese Laser Press. All Rights Reserved 沪ICP备15018463号-20