
Peng-fei JIN, Yu-yu TANG, Jun WEI. Simulation and Noise Analysis of Pushbroom Multi-Gain Spectral Imaging[J]. Spectroscopy and Spectral Analysis, 2022, 42(6): 1922
- Spectroscopy and Spectral Analysis
- Vol. 42, Issue 6, 1922 (2022)
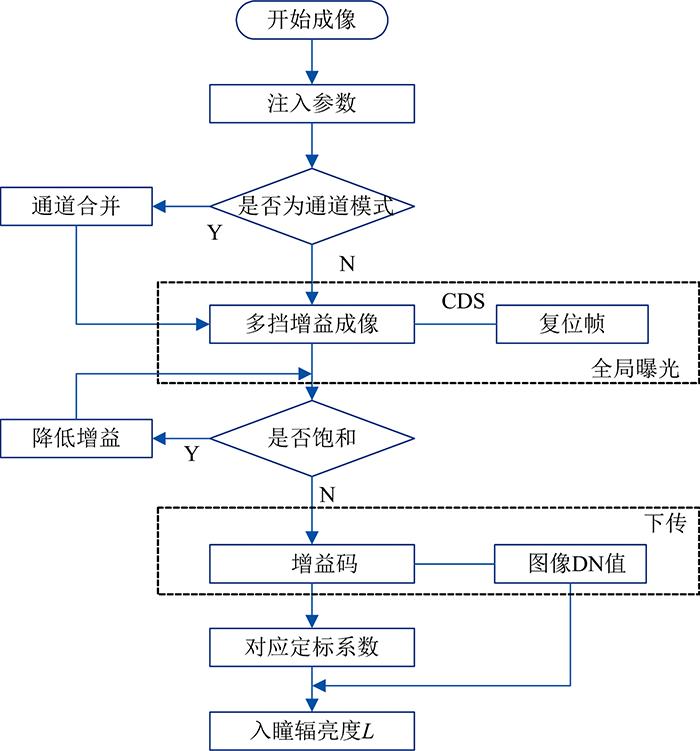
Fig. 1. Flow chart of spectral imaging based on pixel by pixel multiple-gain
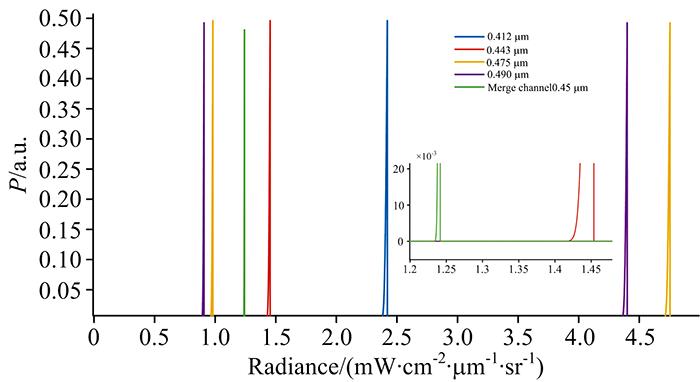
Fig. 2. Probability curve of low gain readout of pixels affected by noise
Fig. 3. SNR curve of each spectrum segment
Fig. 4. Simulation image of pixel by pixel muli-gain spectral imaging
Fig. 5. Imaging simulation with 1~3σ random noise
Fig. 6. Lake texture features after adding 3σ random noise
| ||||||||
Table 1. Relationship between time domain noise and exposure

Set citation alerts for the article
Please enter your email address
© Copyright 2018-2021 | Chinese Laser Press. All Rights Reserved 沪ICP备15018463号-20