
Mei-Mei Wu, Chao Zhang, Can Zhang, Qian-Qian Sun, Mei Liu. Surface enhanced Raman scattering characteristics of three-dimensional pyramid stereo composite substrate [J]. Acta Physica Sinica, 2020, 69(5): 058103-1
- Acta Physica Sinica
- Vol. 69, Issue 5, 058103-1 (2020)
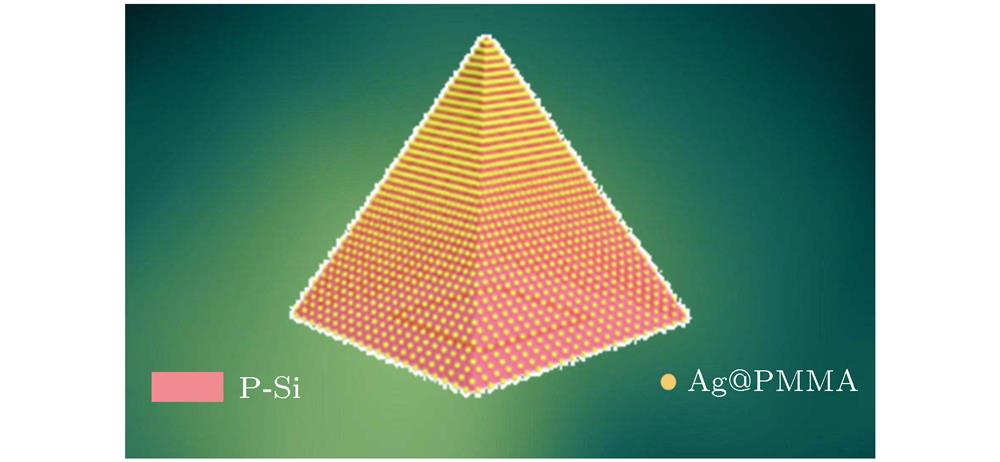
Fig. 1. Schematic diagram of AgNPs@PMMA/P-Si SERS substrate.
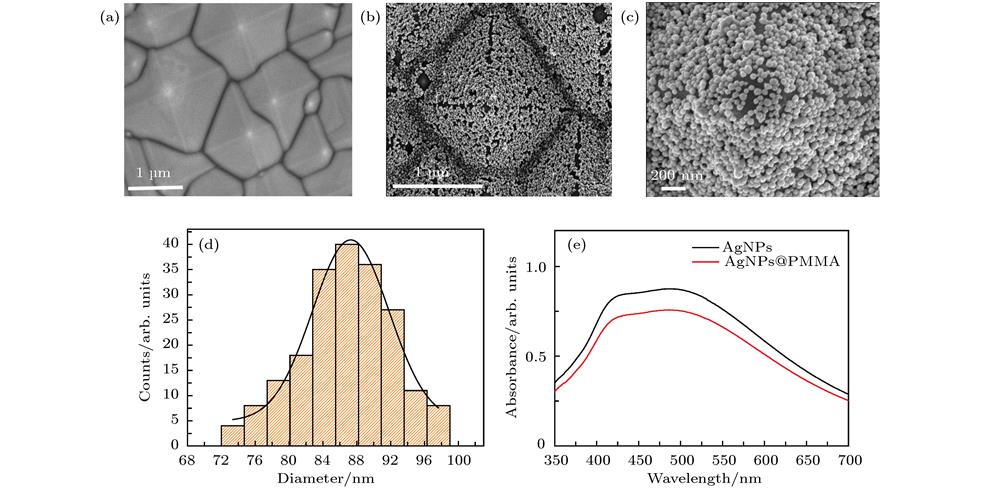
Fig. 2. (a) SEM image of P-Si substrate; (b) SEM image of AgNPs@PMMA/P-Si substrates with AgNPs concentration of 0.75 g/mL in different magnification; (c) size distribution of AgNPs; (d) UV-vis spectra of AgNPs and AgNPs@PMMA solution.
Fig. 3. (a)−(e) SEM images of AgNPs@PMMA/ P-Si substrates with different concentrations of AgNPs in PMMA acetone solution: (a) 0.55 g/mL; (b) 0.65 g/mL; (c) 0.75 g/mL; (d) 0.85 g/mL; (e) 0.95 g/mL
Fig. 4. (a) SERS spectra of R6G (10–7 mol/L) on the AgNPs@PMMA/P-Si substrates fabricated with different concentrations; (b) corresponding to the Raman peak at 614 and 774 cm–1 for the R6G molecule in Fig. (a).
Fig. 5. (a) SERS spectra of R6G with concentrations from 10–10 to 10–14 mol/L on the AgNPs@PMMA/P-Si with AgNPs concentration of 0.75 g/mL substrate; (b) the intensity of R6G peak at 614 cm–1 and 1365 cm–1 changes as a function of R6G molecule concentration on the AgNPs@PMMA/P-Si substrates; (c) schematic illustration showing the Raman detection of SERS substrates; (d) comparison of the detection limit of the R6 G molecule on the 3D composite SERS substrate (10–13 mol/L) and the detection limit (10–4 mol/L) on the planar Si substrate.
Fig. 6. (a) Average SERS spectrum of the 10–7 mol/L R6G molecules from 10 random positions in the base tower of AgNPs@ PMMA/P-Si with concentration of 0.75 g/mL substrate (red line is the average of 10 SERS spectrum lines); (b) statistical diagram of variation of Raman peak intensity at 614 cm–1 is in the corresponding Fig. (a).
Fig. 7. (a) The Raman spectra of R6G molecule with 10–7 mol/L on the AgNPs@PMMA/P-Si, AgNPs@PMMA/F-Si, and AgNPs/P-Si substrates; (b) the intensity of the signal at 614 cm–1 of R6G (10–7 mol/L) collected with 18 days every three days respectively on the AgNPs@PMMA/P-Si and AgNPs/PMMA/F-Si substrate.

Set citation alerts for the article
Please enter your email address
© Copyright 2018-2021 | Chinese Laser Press. All Rights Reserved 沪ICP备15018463号-20