
Ying-qiang ZHANG, Shui-qin ZHANG, Li-yan WANG, Liang YUAN, Yan-ting LI, Qi-zhong XIONG, Zhi-an LIN, Bing-qiang ZHAO. Multispectral Structural Characterization of Low-Molecular-Weight Organic Acids Modified Urea[J]. Spectroscopy and Spectral Analysis, 2021, 41(10): 3129
- Spectroscopy and Spectral Analysis
- Vol. 41, Issue 10, 3129 (2021)
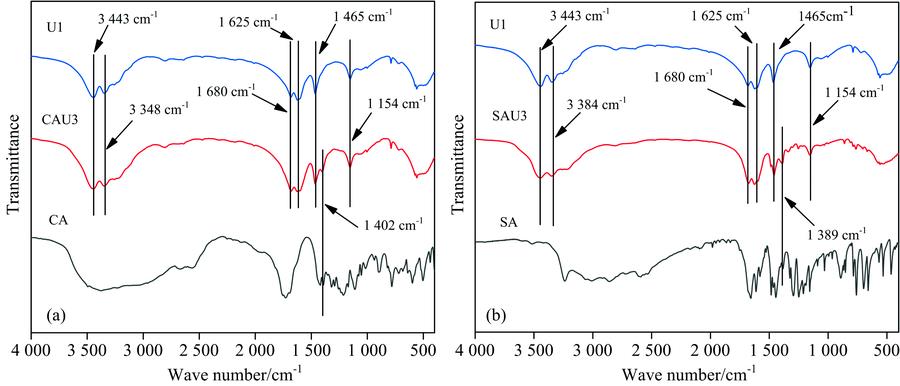
Fig. 1. FTIR spectra of samples
(a): CAU3, et al; (b): SAU3, et al
(a): CAU3, et al; (b): SAU3, et al
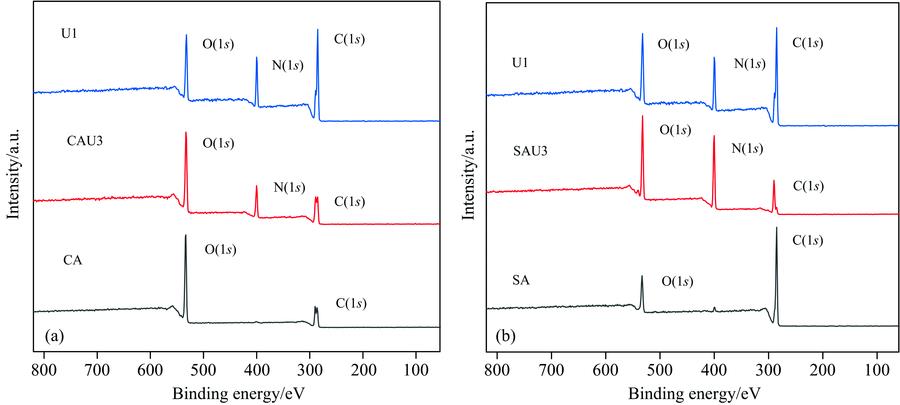
Fig. 2. The XPS full spectra of samples
(a): U1, CAU3, CA; (b): U1, SAU3, SA
(a): U1, CAU3, CA; (b): U1, SAU3, SA
Fig. 3. XPS C(1s ) peak fitting spectra of samples
(a): U1, CAU3, CA; (b): U1, SAU3, SA
(a): U1, CAU3, CA; (b): U1, SAU3, SA
Fig. 4. XPS O(1s ) peak fitting spectra of samples
(a): U1, CAU3, CA; (b): U1, SAU3, SA
(a): U1, CAU3, CA; (b): U1, SAU3, SA
Fig. 5. XPS N(1s ) peak fitting spectra of samples
(a): U1 and CAU3; (b): U1 and SAU3
(a): U1 and CAU3; (b): U1 and SAU3
Fig. 6. Total ion chromatogrom of U1 (a), CAU3(b), SAU3 (c) samples in positive mode
Fig. 7. MS spectra of sample characteristic peaks
(a): The MS spectrum for all samples with retention time of 1.09 min was shown; (b) MS spectrum for CAU3 with retention time of 8.40 min shown; (c), (d): MS spectra for SAU3 with retention time of 8.40, 9.53 min shown, respectively
(a): The MS spectrum for all samples with retention time of 1.09 min was shown; (b) MS spectrum for CAU3 with retention time of 8.40 min shown; (c), (d): MS spectra for SAU3 with retention time of 8.40, 9.53 min shown, respectively
| ||||||||||||||||||||||||||||||||||||||||||||||||
Table 1. Surface carbon atoms content in fertilizerand the contribution of carbon species to C(1s ) peak (%)
| ||||||||||||||||||||
Table 2. Surface oxygen atoms content in fertilizerand the contribution of oxygenspecies to O(1s ) peak (%)
| ||||||||||||||
Table 3. Surface nitrogen atoms content in fertilizer and the contribution of nitrogen species to N(1s ) peak (%)

Set citation alerts for the article
Please enter your email address
© Copyright 2018-2021 | Chinese Laser Press. All Rights Reserved 沪ICP备15018463号-20