
Li Xu, Zhirong Zhang, Fengzhong Dong, Pengshuai Sun, Hua Xia, Runqing Yu, Zhe Li, Qiming Xu. Analytical Method of Spectral Overlapping Interference Using Laser Absorption Spectroscopy[J]. Laser & Optoelectronics Progress, 2019, 56(19): 193003
- Laser & Optoelectronics Progress
- Vol. 56, Issue 19, 193003 (2019)
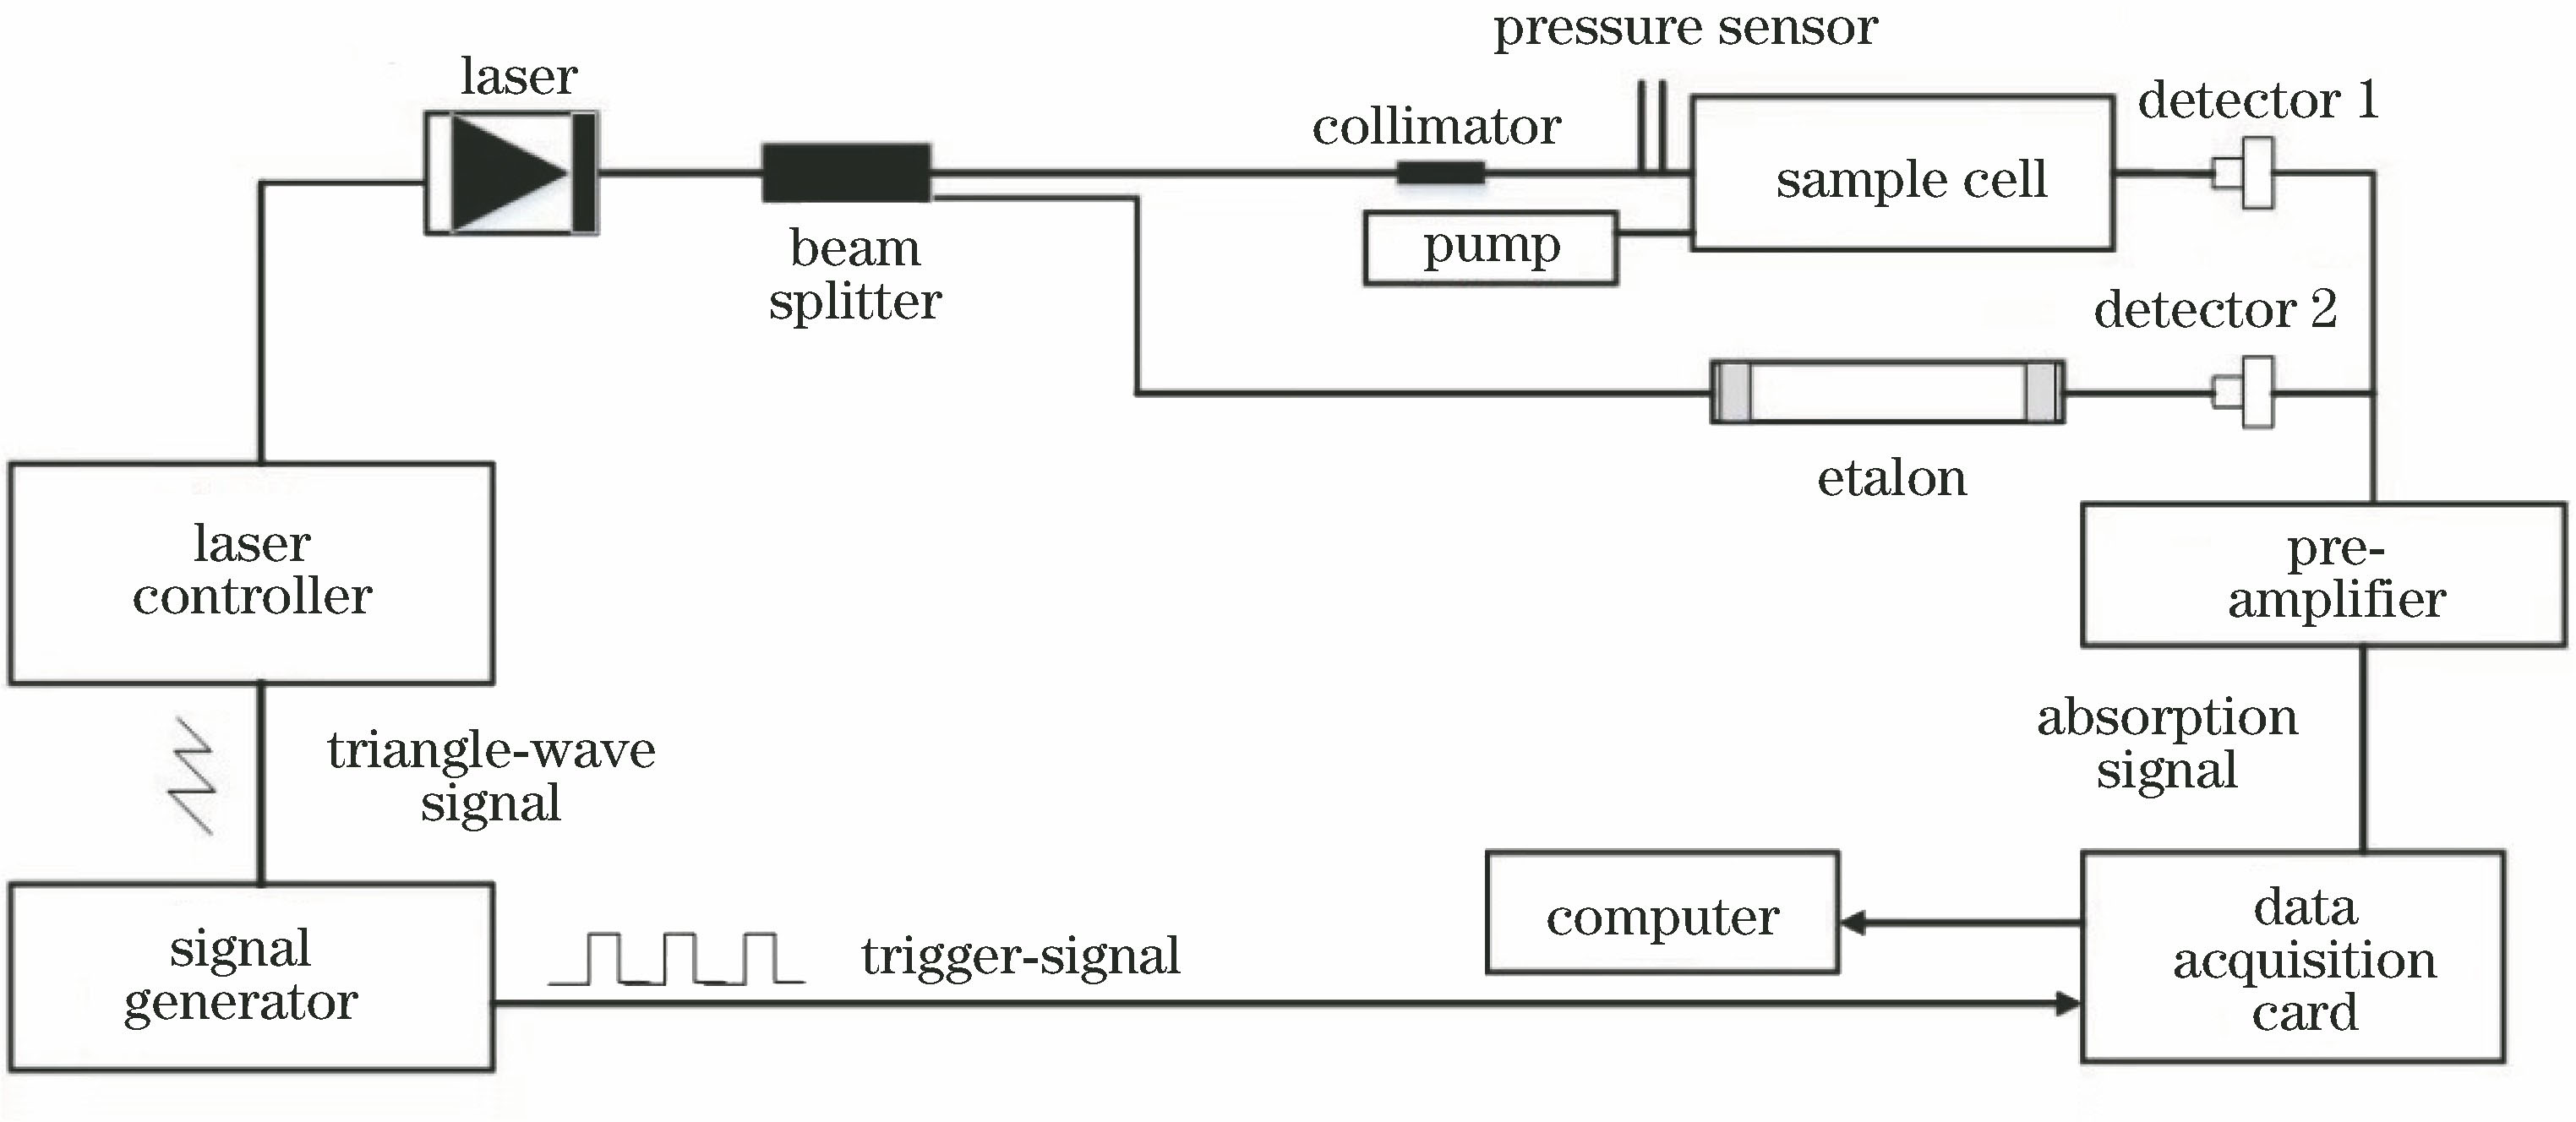
Fig. 1. Schematic of experiment for laser absorption spectroscopy
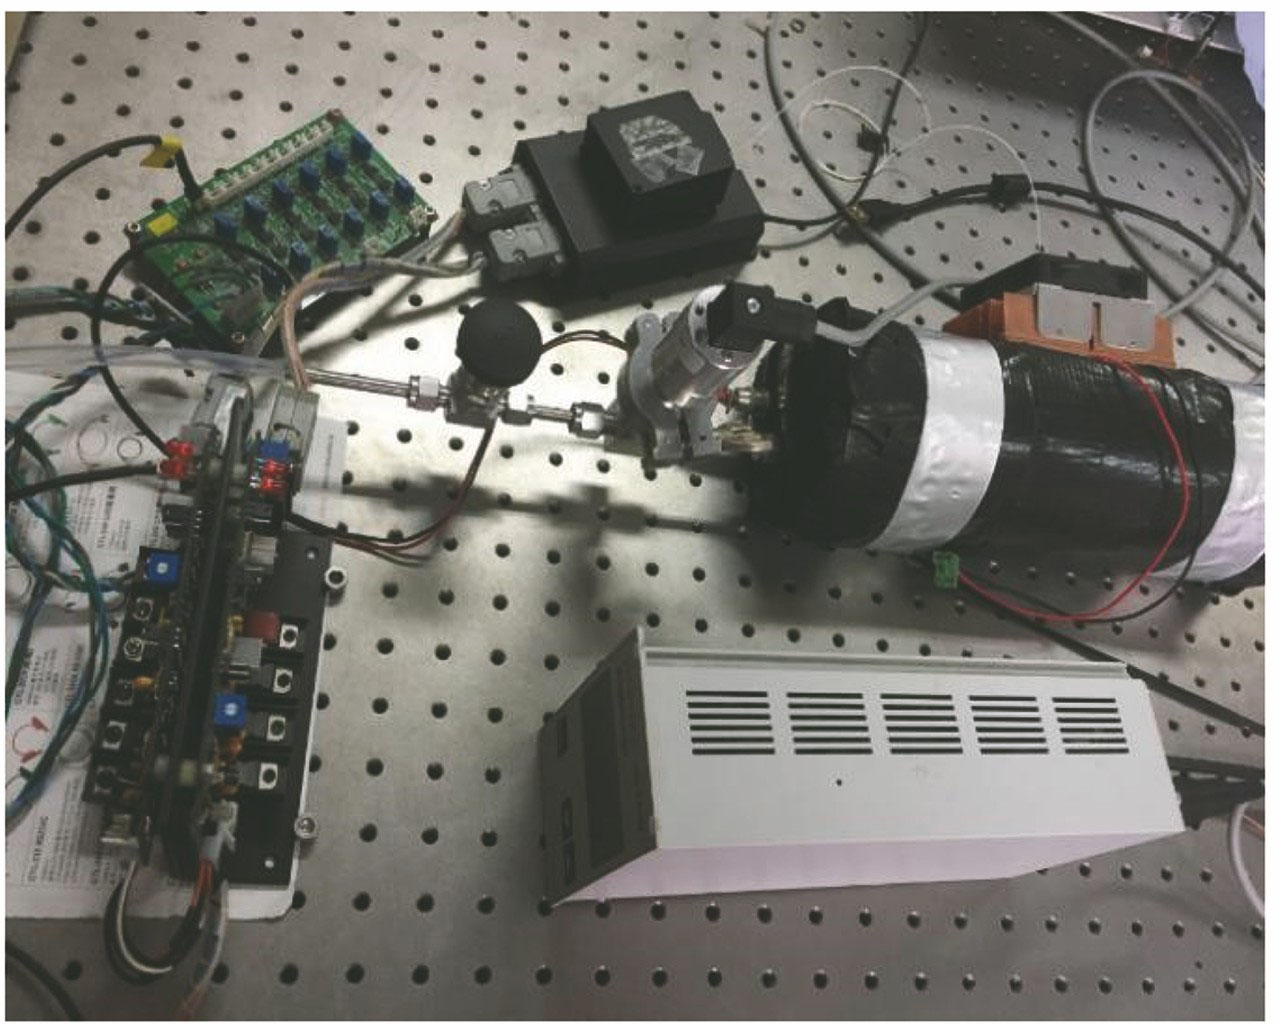
Fig. 2. Picture of experimental device for laser absorption spectroscopy
Fig. 3. Absorption lines of NH3, CO2, and H2O when thermodynamic temperature is 296 K. (a) NH3; (b) CO2; (c) H2O
Fig. 4. Simulated absorption spectrum of NH3 standard gas with volume fraction of 1.9×10⁻⁵
Fig. 5. Simulated absorption spectra under different pressures of NH3 with volume fraction of 1.9×10⁻⁵. (a) 0.5 atm; (b) 0.25 atm; (c) 0.1 atm
Fig. 6. Absorption spectra of NH3 with volume fraction of 1.9×10⁻⁵ under different pressures
Fig. 7. Simulated absorption spectra of CH4 with volume fraction of 10-4 under different pressures. (a) 0.1 atm; (b) 0.2 atm; (c) 0.3 atm; (a) 1.0 atm
Fig. 8. Experimentally measured absorption spectra of CH4 with volume fraction of 10-4 under different pressures
Fig. 9. Measured absorption spectrum of NH3 with volume fraction of 1.9×10⁻⁵ when pressure is 0.18 atm
Fig. 10. Fitting of NH3 concentration and its absorbance when pressure is 0.18 atm
|
Table 1. Absorption line intensity of NH3 standard gas near 6528.8 cm-1 from HITRAN 2012 dataset
|
Table 2. Absorption line intensity of CH4 near 6046.9 cm-1 from HITRAN 2012 dataset
|
Table 3. Maximum absorbance of NH3 with different concentrations under pressure of 0.18 atm

Set citation alerts for the article
Please enter your email address
© Copyright 2018-2021 | Chinese Laser Press. All Rights Reserved 沪ICP备15018463号-20