


[in Chinese], [in Chinese], "Bragg accelerator optimization," High Power Laser Sci. Eng. 2, 03000e24 (2014)
- High Power Laser Science and Engineering
- Vol. 2, Issue 3, 03000e24 (2014)
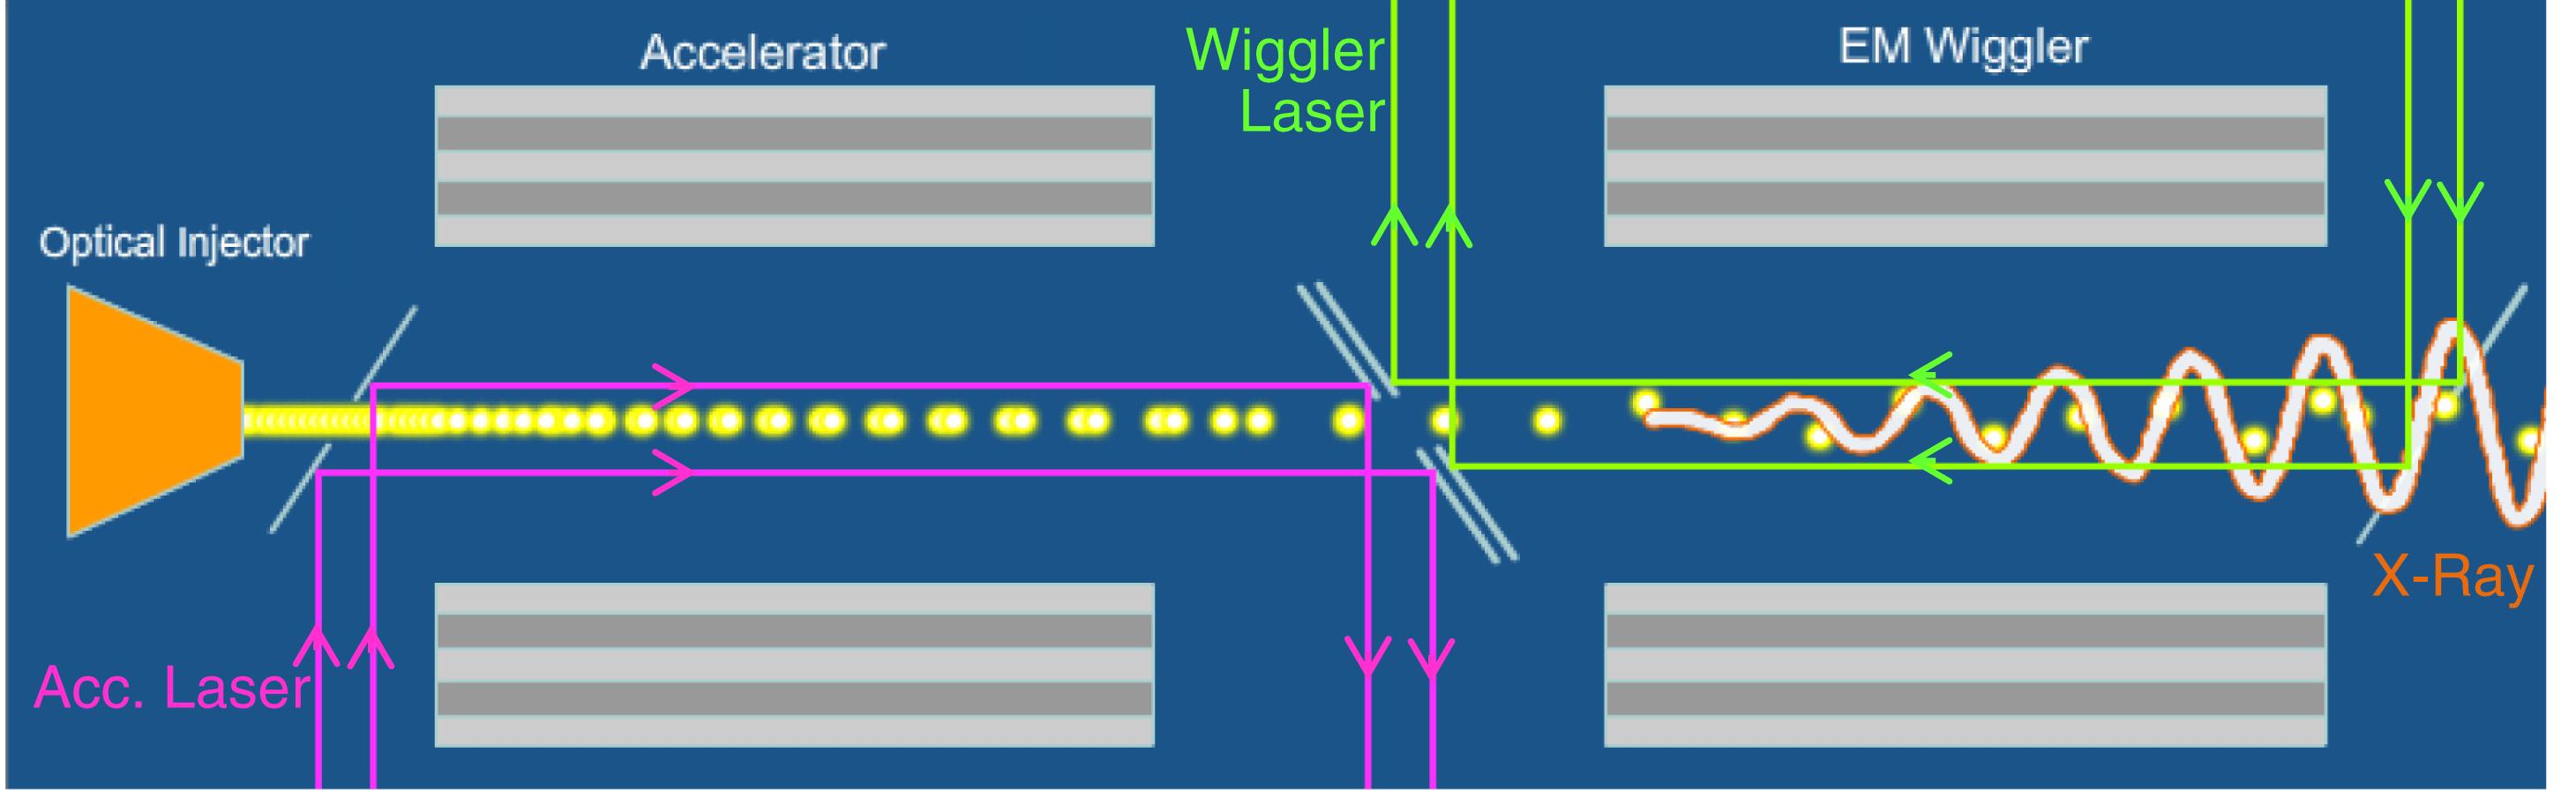
Fig. 1. Schematic of an all-Bragg system. On the left, the Bragg accelerator supports a co-propagating  mode which accelerates the e-beam. The latter is injected into another Bragg structure which supports a TEM mode (inside the vacuum core) counter-propagating to the electrons, which as a result generates X-ray radiation.
mode which accelerates the e-beam. The latter is injected into another Bragg structure which supports a TEM mode (inside the vacuum core) counter-propagating to the electrons, which as a result generates X-ray radiation. 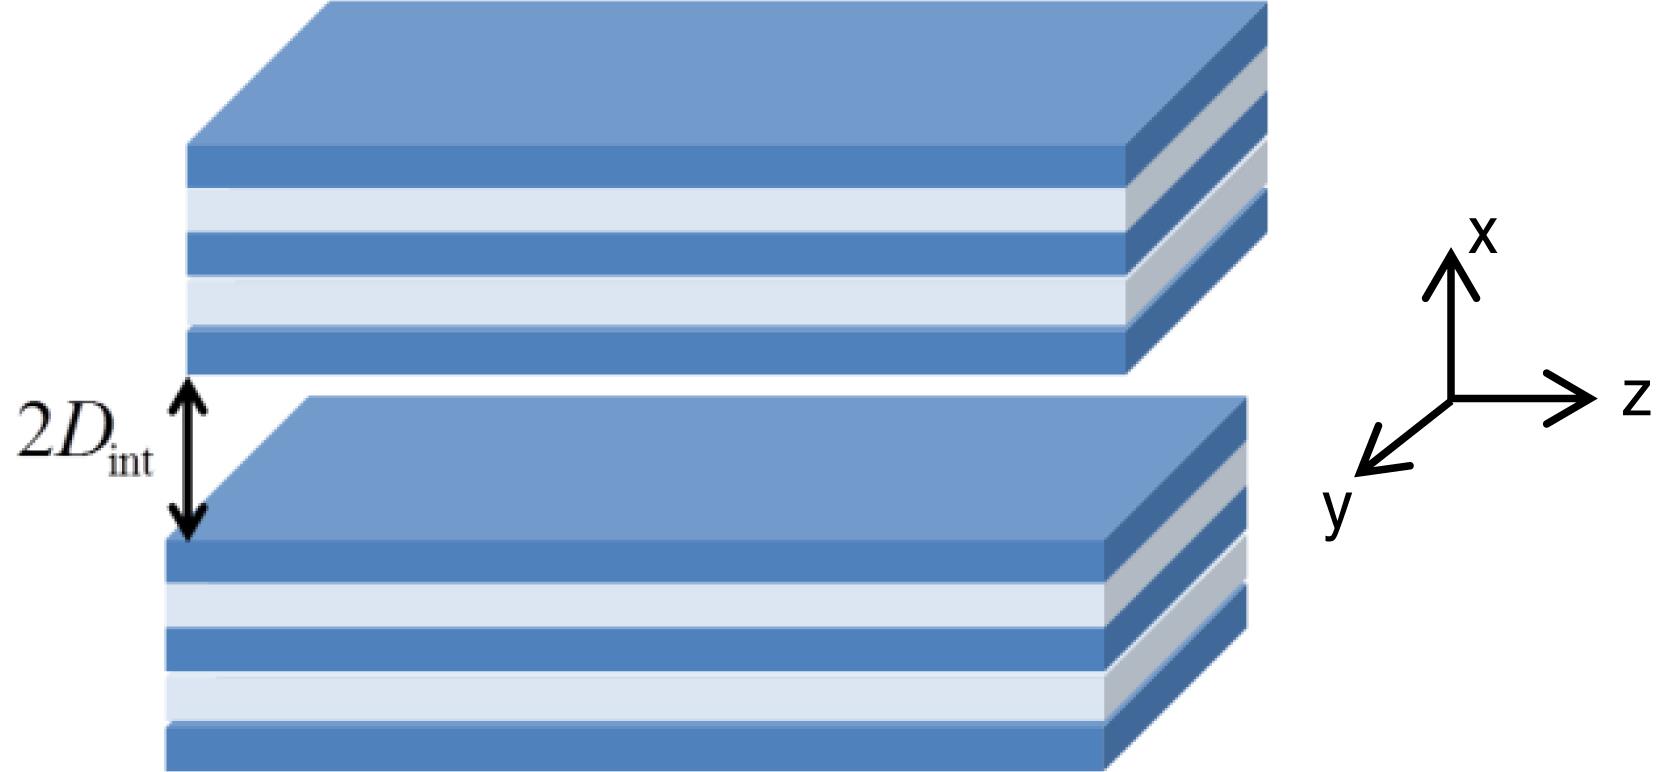
Fig. 2. Planar Bragg waveguide with a vacuum region of width  .
.
. Fig. 3. (a) Gradient versus clearance of the accelerator structure. Red line for a single bunch and green line for  . As the clearance is increased, the gradient drops. (b) Gradient versus number of micro-bunches in the train. Red line for
  ; green line for
  , multiplied by a factor (2.377) such that at
  both curves coincide for
  (
( ). There is a critical value at approximately
  .
.
. As the clearance is increased, the gradient drops. (b) Gradient versus number of micro-bunches in the train. Red line for ; green line for , multiplied by a factor (2.377) such that at both curves coincide for (). There is a critical value at approximately . Fig. 4. Maximum efficiency for a single bunch versus half clearance width (Equation (6 )).
Fig. 5. Wake coefficient, interaction impedance, and group velocity versus half clearance width. Each of the parameters is normalized to its maximum value.
Fig. 6. (a) Maximum efficiency versus number of micro-bunches in the train. Red line for  and green line for
  . The optimum value is 15% for
  . (b) Maximum efficiency normalized to the single bunch case versus clearance of the accelerator structure. For each clearance there is an optimal value for
  .
.
and green line for . The optimum value is 15% for . (b) Maximum efficiency normalized to the single bunch case versus clearance of the accelerator structure. For each clearance there is an optimal value for . Fig. 7. Number of electrons in a microbunch (left  -axis) and number of electrons in the train (right
  -axis) versus the number of micro-bunches for
  ,
,  .
.
-axis) and number of electrons in the train (right -axis) versus the number of micro-bunches for , . Fig. 8. Average laser power for  ,
,  . Its maximum (170 kW) occurs for
  ,
,  .
.
, . Its maximum (170 kW) occurs for , . Fig. 9. Planar waveguide acceleration module with a vacuum region of width  . The e-beam is accelerated by a co-propagating
  laser mode. The macrobunch consists of a train of
  line charges, separated by a laser wavelength.
. The e-beam is accelerated by a co-propagating laser mode. The macrobunch consists of a train of line charges, separated by a laser wavelength. Fig. 10. Spectrum of the decelerating field multiplied by the ‘sinc’ function of the number of micro-bunches:  on a log–log scale. Frequencies other than the fundamental are suppressed as the number of micro-bunches in the train increases.
on a log–log scale. Frequencies other than the fundamental are suppressed as the number of micro-bunches in the train increases.
|
Table 1. Typical Values of the Parameters for  .
.
. 

Set citation alerts for the article
Please enter your email address

© Copyright 2018-2021 | Chinese Laser Press. All Rights Reserved 沪ICP备15018463号-20