• Laser & Optoelectronics Progress
  • Vol. 58, Issue 24, 2428008 (2021)
Shihao Guan1, Guang Yang1、*, Shan Lu2, Chunbai Jin1, Hao Li3, and Zhaohong Xu4
Author Affiliations
  • 1Aviation University of Air Force, Changchun, Jilin 130022, China
  • 2School of Geographic Science, Northeast Normal University, Changchun, Jilin 130024, China
  • 395910 Troop of PLA, Jiuquan, Gansu 735000, China
  • 495795Troop of PLA, Guilin, Guangxi 541000, China
  • show less
    DOI: 10.3788/LOP202158.2428008 Cite this Article Set citation alerts
    Shihao Guan, Guang Yang, Shan Lu, Chunbai Jin, Hao Li, Zhaohong Xu. Hyperspectral Semi-Supervised Classification Algorithm Based on Improved Ladder Network[J]. Laser & Optoelectronics Progress, 2021, 58(24): 2428008 Copy Citation Text show less
    Process of two-dimensional convolution
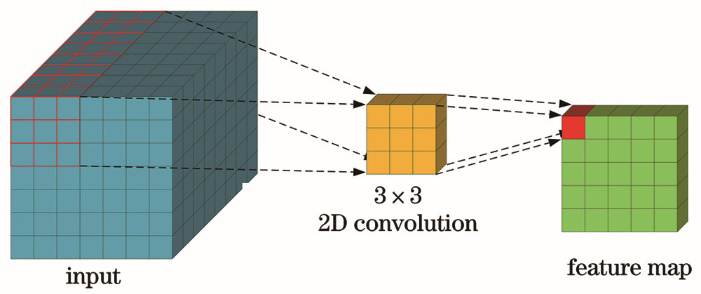
    Fig. 1. Process of two-dimensional convolution
    Process of three-dimensional convolution
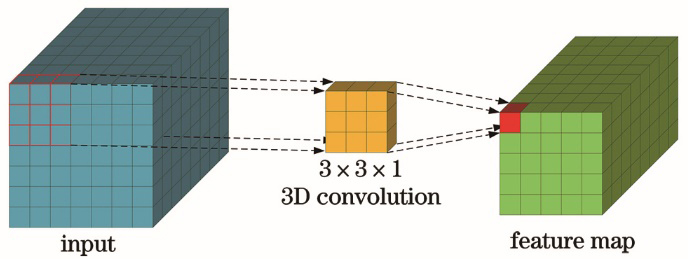
    Fig. 2. Process of three-dimensional convolution
    Structure of LSTM network
    Fig. 3. Structure of LSTM network
    Structure of ladder network
    Fig. 4. Structure of ladder network
    Structure of 3D-CNN-LSTM network
    Fig. 5. Structure of 3D-CNN-LSTM network
    Model of semi-supervised classification algorithm based on improved ladder network
    Fig. 6. Model of semi-supervised classification algorithm based on improved ladder network
    Structure of 3D-CNN-LSTM ladder network
    Fig. 7. Structure of 3D-CNN-LSTM ladder network
    True color image and ground truth map of Pavia University dataset. (a) True color image; (b) ground truth map
    Fig. 8. True color image and ground truth map of Pavia University dataset. (a) True color image; (b) ground truth map
    True color image and ground truth map of Indian Pines dataset. (a) True color image; (b) ground truth map
    Fig. 9. True color image and ground truth map of Indian Pines dataset. (a) True color image; (b) ground truth map
    Classification results of different algorithms on Pavia University dataset. (a) True color image; (b) feature label map; (c) M3D-DCNN algorithm; (d) 3D-CNN-LSTM algorithm; (e) SS-CNN algorithm; (f) S4CNN algorithm; (g) 3D-CNN-LSTM-LN algorithm
    Fig. 10. Classification results of different algorithms on Pavia University dataset. (a) True color image; (b) feature label map; (c) M3D-DCNN algorithm; (d) 3D-CNN-LSTM algorithm; (e) SS-CNN algorithm; (f) S4CNN algorithm; (g) 3D-CNN-LSTM-LN algorithm
    Classification results of different algorithms on Indian Pines dataset. (a) True color image; (b) feature label map; (c) M3D-DCNN algorithm; (d) 3D-CNN-LSTM algorithm; (e) SS-CNN algorithm; (f) S4CNN algorithm; (g) 3D-CNN-LSTM-LN algorithm
    Fig. 11. Classification results of different algorithms on Indian Pines dataset. (a) True color image; (b) feature label map; (c) M3D-DCNN algorithm; (d) 3D-CNN-LSTM algorithm; (e) SS-CNN algorithm; (f) S4CNN algorithm; (g) 3D-CNN-LSTM-LN algorithm
    LayerKernel sizeInput sizeOutput sizeNumber of convolution kernelsActivation function
    Input----11×11×30----
    Conv-1(Conv 3D)3×3×111×11×309×9×304--
    BN-1--9×9×309×9×30--ReLU
    Pooling-1(MaxPooling)1×1×29×9×309×9×15----
    Conv-2(Conv 3D)3×3×19×9×157×7×158--
    BN-2--7×7×157×7×15--ReLU
    Pooling-2(MaxPooling)1×1×27×7×157×7×7----
    Conv-3(Conv 3D)3×3×17×7×75×5×716--
    BN-3--5×5×75×5×7--ReLU
    Pooling-3(MaxPooling)1×1×25×5×75×5×3----
    Linear-1(flatten)--5×5×31×75----
    RNN-1(Bi-LSTM)--1200×1400×1--Tanh
    Table 1. Network structure of encoder in 3D-CNN-LSTM-LN model
    No.ClassM3D-DCNN3D-CNN-LSTMSS-CNNS4CNN3D-CNN-LSTM-LN
    1Asphalt93.2593.0394.9896.9499.21
    2Meadow98.1496.9996.8499.1199.63
    3Gravel76.8375.1389.1686.9796.22
    4Tree97.7891.4593.5098.3398.94
    5Metal sheet100.0096.6399.3399.7899.66
    6Bare soil92.8790.3192.2897.4099.18
    7Bitumen80.5686.9783.2191.7697.79
    8Brick83.1483.9590.9293.5098.13
    9Shadow94.2588.5296.8497.0098.55
    OA--93.7392.4694.4697.0699.03
    AA--90.6289.1392.9695.6498.59
    Kappa--91.7089.9092.8096.2098.80
    Table 2. Classification accuracy of different algorithms on Pavia University dataset unit: %
    No.ClassM3D-DCNN3D-CNN-LSTMSS-CNNS4CNN3D-CNN-LSTM-LN
    1Alfalfa39.1277.6581.9197.2396.85
    2Corn-notill77.9582.4583.2491.7796.93
    3Corn-mintill88.6782.3674.3489.3493.97
    4Corn87.0266.7579.6796.3897.15
    5Grass-pasture95.4393.1797.6592.9395.49
    6Grass-tree98.7895.3688.9699.3698.17
    7Grass-pasture-mowed70.3188.9575.0297.7262.13
    8Hay-windrowed95.3397.3489.6198.3398.88
    9Oat53.3556.0282.4772.0357.15
    10Soybean-notill81.6390.1482.3592.1997.31
    11Soybean-mintill86.2788.4682.6392.8498.19
    12Soybean-clean80.6874.2883.2883.9692.56
    13Wheat99.4597.6781.3697.9599.70
    14Wood94.5998.3287.6497.7199.65
    15Building-grass-tree-drive76.9590.2480.2789.7295.12
    16Stone-steel-tower95.2746.8397.7990.9893.35
    OA--87.2088.8389.5693.3497.04
    AA--82.5183.2284.2682.4092.03
    Kappa--85.3087.2088.8092.3096.60
    Table 3. Classification accuracy of different algorithms on Indian Pines dataset unit: %
    Shihao Guan, Guang Yang, Shan Lu, Chunbai Jin, Hao Li, Zhaohong Xu. Hyperspectral Semi-Supervised Classification Algorithm Based on Improved Ladder Network[J]. Laser & Optoelectronics Progress, 2021, 58(24): 2428008
    Download Citation