
Shipeng Liu, Fengxi Li, Zhenhong Xing, Bingjun Cui, Shuyi Dai. Fabrication of Medical Titanium Alloy Microhole Array Substrates Based on High-Speed Polygon Mirror[J]. Laser & Optoelectronics Progress, 2022, 59(17): 1714002
- Laser & Optoelectronics Progress
- Vol. 59, Issue 17, 1714002 (2022)
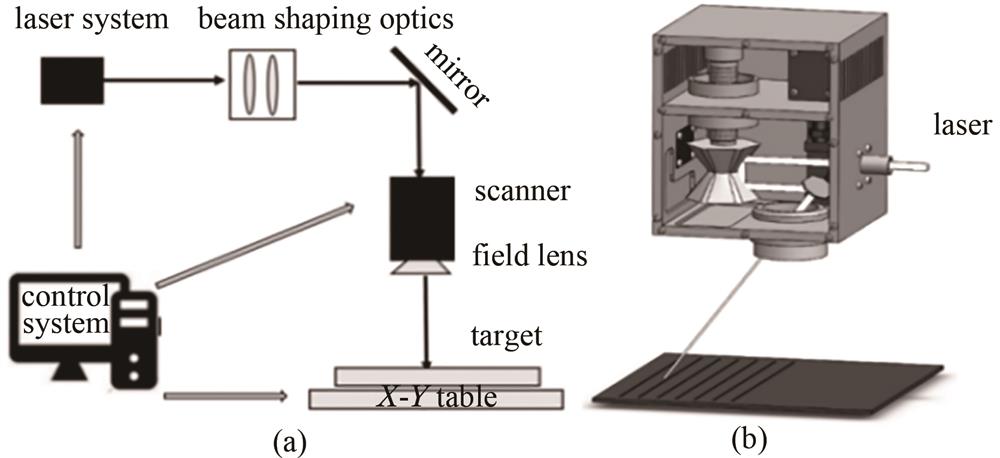
Fig. 1. Test setup diagram. (a) Experimental processing system; (b) high-speed polygon mirror scanning device
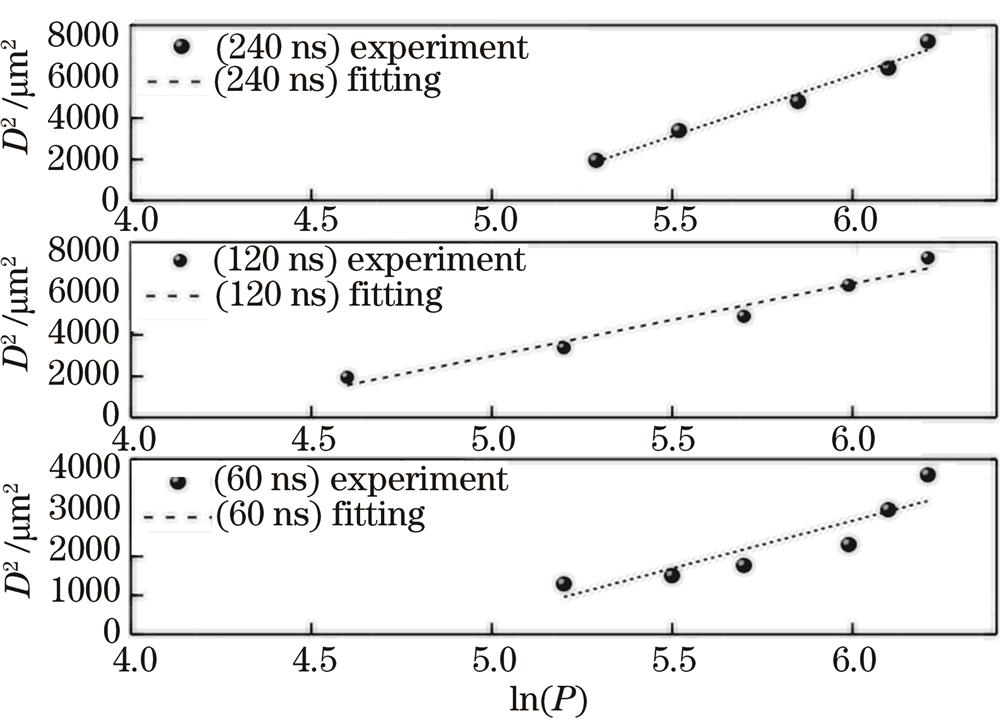
Fig. 2. Relationship between burning aperture and logarithm of power
Fig. 3. Variation of burning aperture with increasing laser power
Fig. 4. Variation curves of hole inlet diameter, outlet diameter, and hole taper of 0.1 mm titanium alloy with laser incident power
Fig. 5. Variation of laser drilling depth and morphology with increasing laser power
Fig. 6. High-speed polygon mirror laser processing 0.3 mm titanium alloy micro group holes substrate. (a) Microhole arrays arrangement; (b) microhole arrays dislocation arrangement
Fig. 7. Variation of hole morphology with scanning speed. (a) Scanning speed is 160 m/s; (b) scanning speed is 500 m/s
Fig. 8. Medical titanium alloy microhole substrate covered and filled with povidone
Fig. 9. Quincunx spot structure
Fig. 10. Aperture comparison before and after process optimization. (a) Before optimization; (b) after optimization
|
Table 1. Specific parameters of laser
|
Table 2. Specific parameters of scanning device
|
Table 3. Efficiency of micro group holes processed by the high-speed polygon mirror

Set citation alerts for the article
Please enter your email address
© Copyright 2018-2021 | Chinese Laser Press. All Rights Reserved 沪ICP备15018463号-20